Technical indicators are among the most widely discussed tools in stock trading, yet they are also among the most misunderstood. For many traders, indicators become mechanical objects placed on charts with the expectation that they will generate clear buy and sell signals. Lines cross, oscillators hit certain levels, alerts trigger—and trades are executed without a true understanding of what the indicator is actually measuring.
This approach almost always leads to frustration.
In reality, technical indicators do not generate signals on their own. They are mathematical interpretations of price, volume, and volatility, designed to organize information that already exists in the market. When used correctly, indicators help traders reduce emotional bias, improve consistency, and build structured decision-making processes. When used incorrectly, they create dependency, confusion, and overtrading.
This guide explains technical indicators in depth—how they are built, what they measure, when they work, when they fail, and how professional traders integrate them into a structured trading process. The goal is not to promote indicators as shortcuts, but to explain them as analytical tools that support disciplined trading.
Understanding the Core Purpose of Technical Indicators
Before discussing individual indicators, it is critical to understand why indicators exist in the first place.
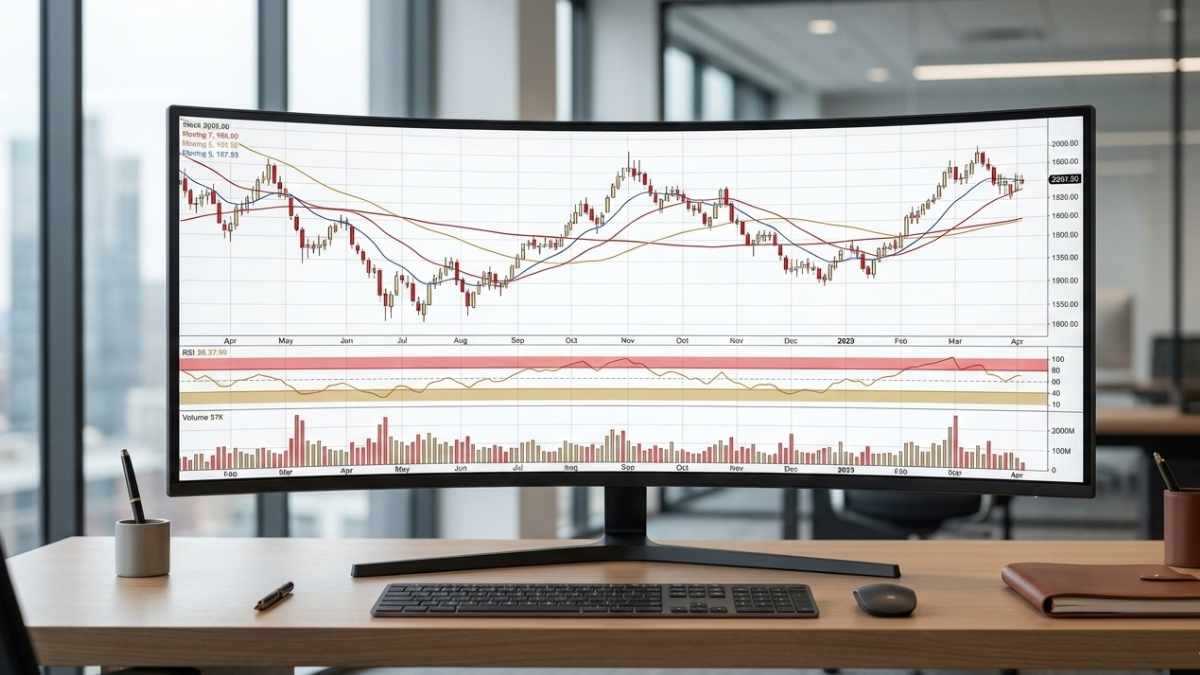
Price data alone can be noisy, emotionally misleading, and difficult to quantify consistently. A raw price chart reflects constant fluctuations caused by short-term order flow, news reactions, and trader psychology. While experienced traders can read price action directly, most traders need tools that help them organize and filter information.
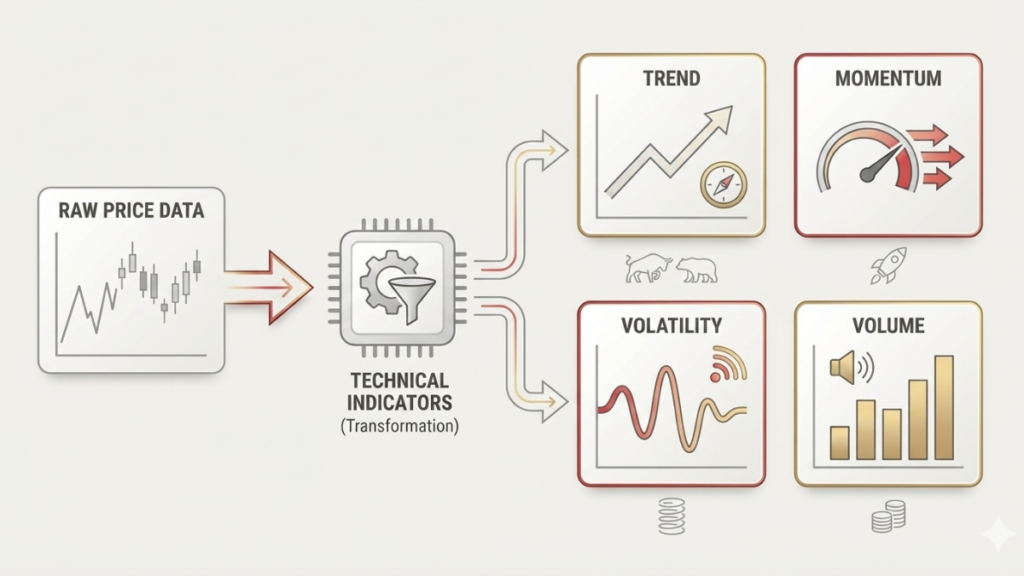
Technical indicators compress market information into interpretable metrics. They transform raw price and volume data into forms that highlight specific characteristics of market behavior. Importantly, they do not predict the future. Instead, they describe the current state of the market more clearly.
Indicators help traders answer practical questions such as whether the market is trending or ranging, whether momentum is strengthening or weakening, whether volatility is expanding or contracting, and whether participation is increasing or decreasing. Each indicator exists to answer one specific question. Expecting an indicator to do more than that is the root cause of misuse.
The Mathematical Nature of Indicators and Why They Lag
All technical indicators are derived from historical data. This includes past prices, past volume, and past volatility. Because indicators are calculated using completed candles or bars, they are inherently reactive. This means every indicator lags price to some extent.
Even indicators often described as “leading” still rely on historical inputs. The difference between leading and lagging indicators is not whether they use past data, but how they process that data. Leading indicators react faster but are more sensitive to noise, while lagging indicators react slower but provide greater stability.
Professional traders accept lag as a trade-off for reduced noise, improved clarity, and higher probability decisions. The objective is not to eliminate lag, but to use it intelligently. Lag helps confirm behavior rather than anticipate it prematurely.
Classification of Technical Indicators
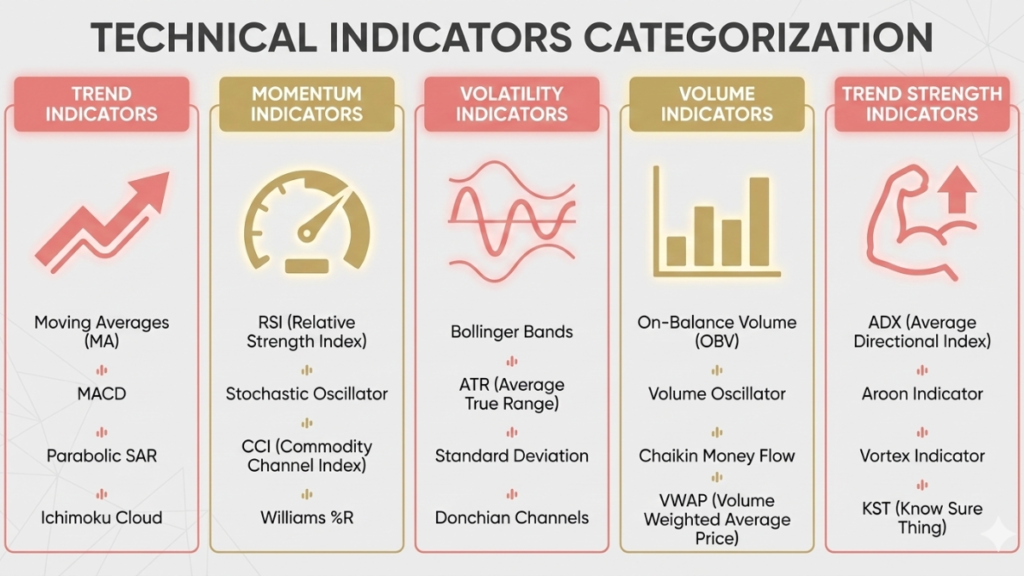
Technical indicators fall into five primary categories, each serving a different analytical function. Understanding these categories helps traders select the right tool for the right purpose.
The five major categories are trend indicators, momentum indicators, volatility indicators, volume indicators, and trend strength indicators. No single category is sufficient on its own. Effective analysis comes from combining insights across categories.
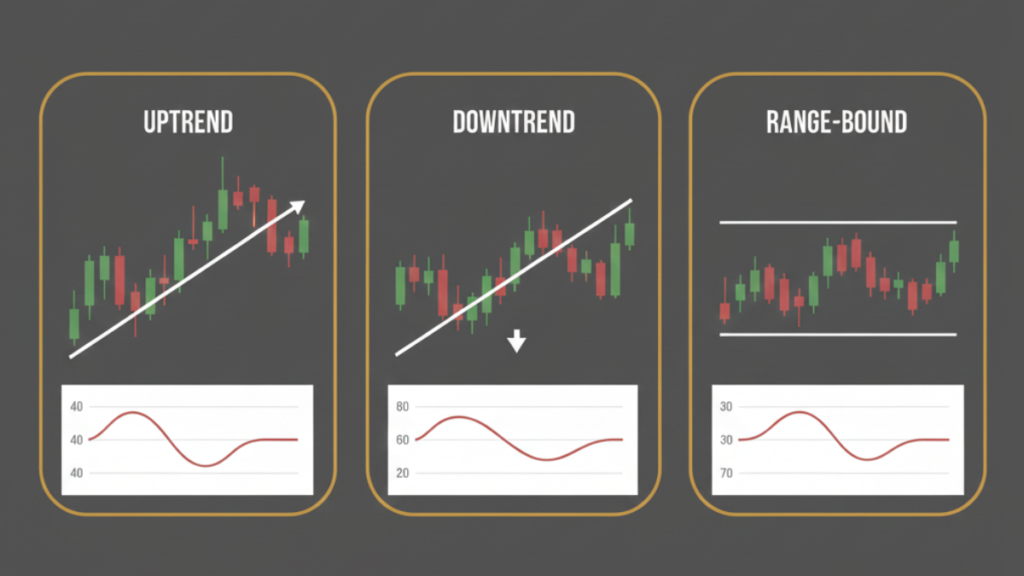
Trend Indicators and Market Direction
Trend indicators help determine whether price is moving with directional intent or not. A trend represents sustained imbalance between buyers and sellers. Most professional traders prefer to trade in the direction of the trend because trends reflect institutional participation rather than random retail activity.
Moving Averages (MA): Deep Explanation
Moving averages are the most widely used trend indicators. A moving average calculates the average price over a fixed lookback period, smoothing short-term fluctuations to reveal underlying direction.
A Simple Moving Average (SMA) assigns equal weight to all data points in the lookback period. Because it reacts slowly to price changes, it is commonly used for identifying long-term trends and major market structure.
An Exponential Moving Average (EMA) assigns greater weight to recent prices. This makes it more responsive to current market conditions and better suited for short-term, swing, and intraday trading.
Commonly used periods include the 20 EMA for short-term trends, the 50 EMA for medium-term trends, and the 200 EMA for long-term trends. These levels are widely observed by market participants, which increases their relevance.
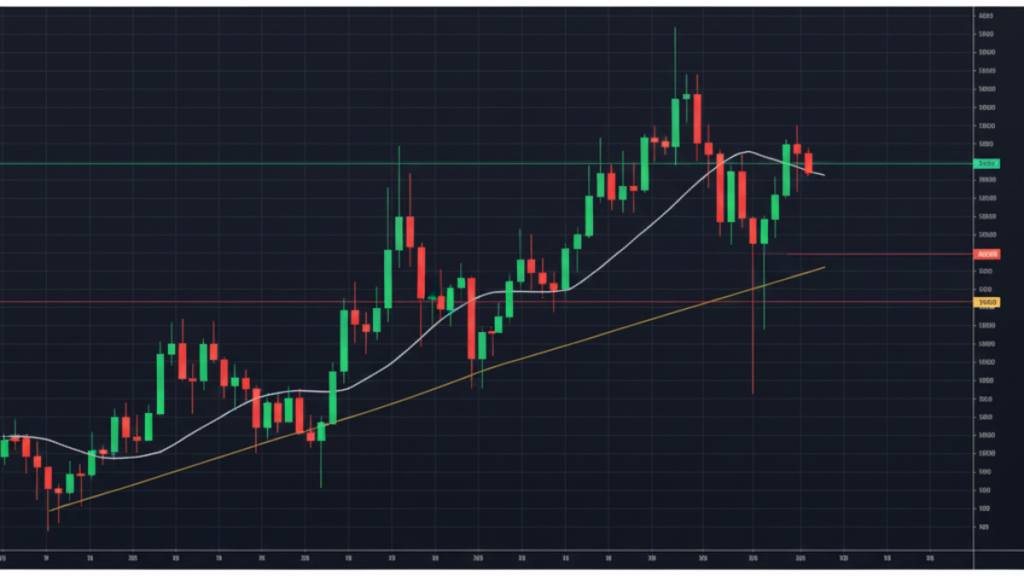
How Moving Averages Represent Market Behavior
Moving averages represent more than just averages. They reflect consensus price over time, dynamic equilibrium between buyers and sellers, and areas where institutional orders are often concentrated. When price repeatedly respects a moving average, it suggests organized participation rather than random movement.
Dynamic Support and Resistance
In trending markets, moving averages often function as dynamic support and resistance zones. In an uptrend, price tends to pull back toward an EMA before continuing higher. In a downtrend, price often rallies toward an EMA before resuming lower.
Professionals observe how price behaves around the moving average. Strong rejection suggests trend continuation, while acceptance or prolonged consolidation may indicate weakening momentum.
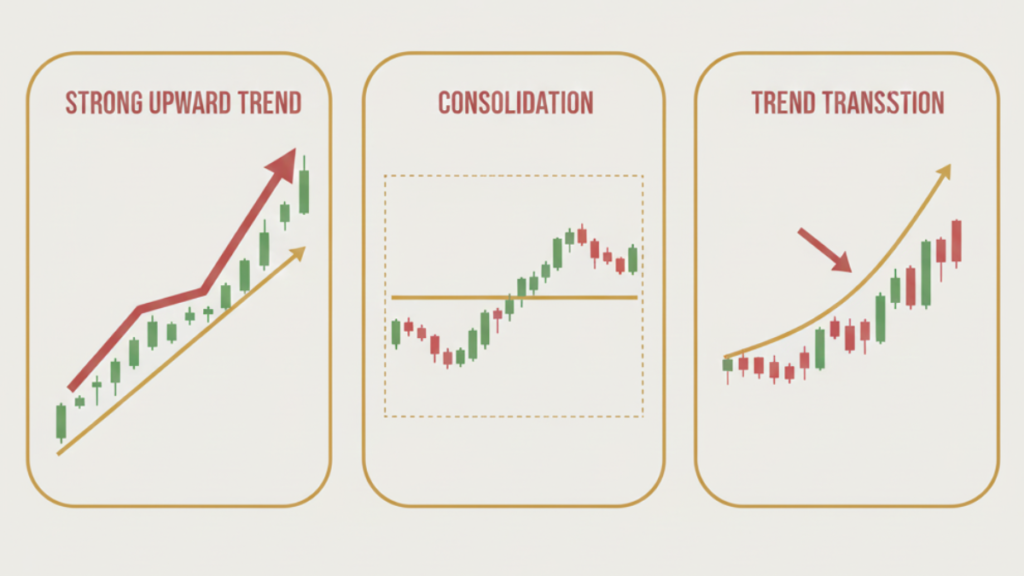
Moving Average Slope and Trend Quality
The slope of a moving average is often more important than its position. A steep slope indicates strong directional commitment, while a flat slope suggests consolidation or transition. Changes in slope often precede changes in market behavior.
Moving Average Crossovers from a Professional Perspective
Moving average crossovers occur when a shorter-term average crosses above or below a longer-term average. While popular, crossovers are among the most misused signals.
Crossovers lag because they occur only after price has already moved significantly. Professionals therefore use crossovers as confirmation tools, not entry triggers. Crossovers are most effective when aligned with price structure, momentum indicators, and volume analysis.
Momentum Indicators and the Strength of Movement
Momentum indicators measure how fast price is changing, not the direction of movement. They help traders understand whether a move is accelerating, decelerating, or losing strength.
Relative Strength Index (RSI): Advanced Understanding
RSI compares average gains to average losses over a defined lookback period, typically 14 periods. It oscillates between 0 and 100, providing a standardized measure of momentum.
RSI measures internal strength of price movement, sustainability of trend momentum, and speed of participation. Contrary to popular belief, RSI is not primarily a reversal indicator.
In strong uptrends, RSI often remains between 40 and 80. In strong downtrends, RSI often remains between 20 and 60. This shift in behavior reflects changing market dynamics.
RSI Divergence as a Professional Tool
RSI divergence occurs when price makes higher highs while RSI makes lower highs, or when price makes lower lows while RSI makes higher lows. Divergence indicates momentum exhaustion, not immediate reversal.
Professionals treat divergence as a warning signal that must be confirmed by price structure and key levels. Used alone, divergence often leads to premature entries.
Stochastic Oscillator and Precision Timing
The stochastic oscillator measures where the closing price lies relative to its recent trading range. It is particularly effective in range-bound markets where price oscillates between support and resistance.
Stochastic identifies overextension within a range but performs poorly in strong trends, where price can remain overbought or oversold for extended periods. Professionals use stochastic selectively rather than universally.
Volatility Indicators and Market Expansion
Volatility indicators measure how much price is moving, not the direction of movement. Volatility is crucial for risk management, position sizing, and trade selection.
Bollinger Bands and Volatility Structure
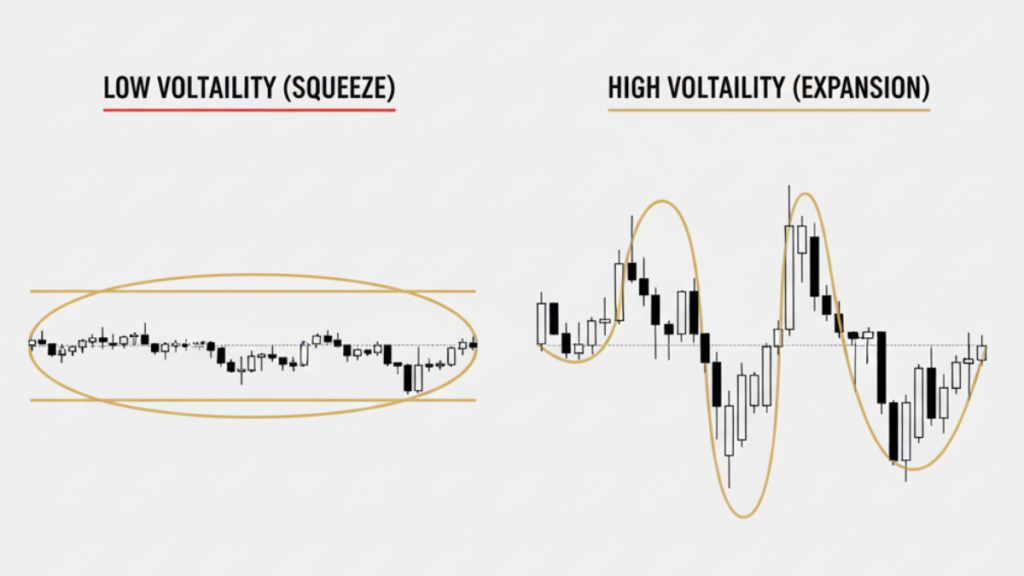
Bollinger Bands consist of a middle moving average and two outer bands based on standard deviation. When volatility is low, the bands contract. When volatility increases, the bands expand.
A Bollinger squeeze indicates compression and reduced participation. Compression often precedes expansion, but direction must be determined using price structure and volume.
Professionals do not trade volatility expansion blindly. They wait for confirmation.
Average True Range (ATR) as a Risk Tool
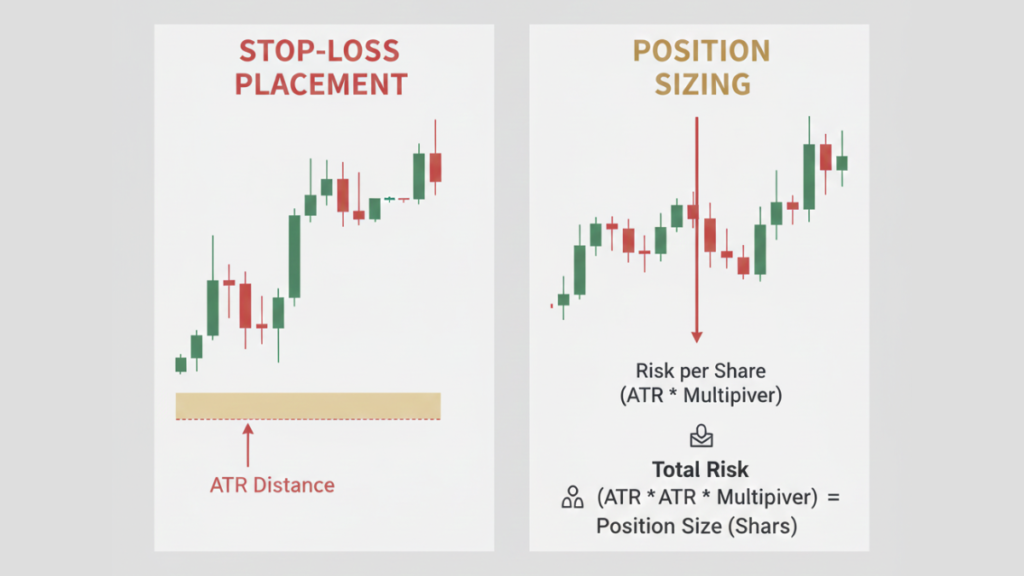
ATR measures average price movement over a specified period. It does not indicate direction and should not be used for entries.
Professionals use ATR to calculate stop-loss distance, adjust position sizing, and align risk with current market conditions. ATR-based risk management prevents stops that are too tight and exits driven by normal market noise.
Volume Indicators and Market Participation
Volume reveals participation and conviction. Price movement without volume is often fragile and prone to failure.
Volume Analysis in Professional Trading
Healthy trends typically show increasing volume during impulsive moves and decreasing volume during pullbacks. This pattern suggests institutional accumulation or distribution rather than random trading.
Low-volume breakouts often fail because they lack broad participation.
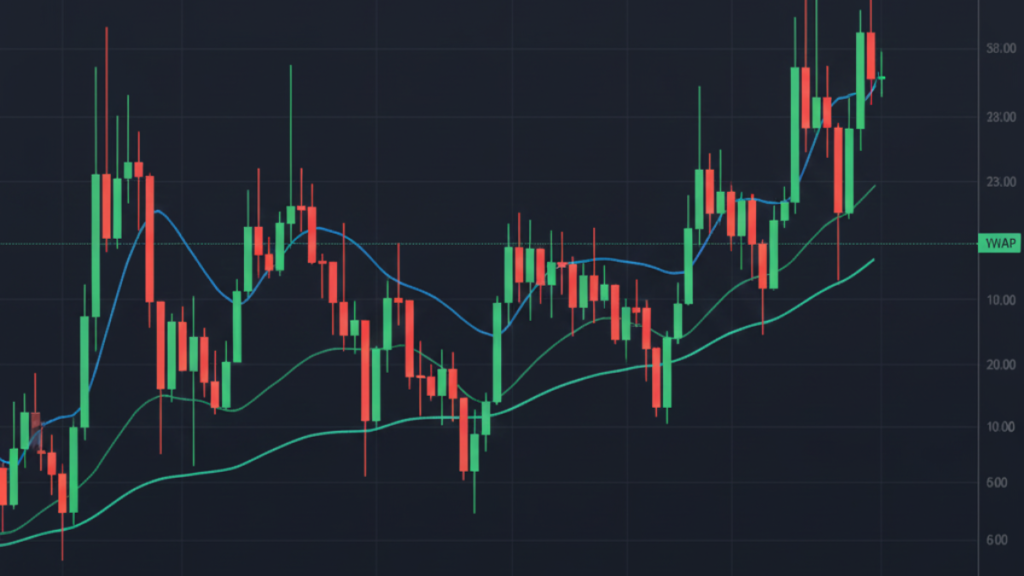
VWAP as an Institutional Benchmark
VWAP represents the average price traded, weighted by volume. It is widely used by institutional traders to assess execution quality and cost efficiency.
Retail traders use VWAP to align with institutional bias, identify mean reversion opportunities, and avoid chasing extended price moves. VWAP is most effective in intraday contexts.
Trend Strength Indicators and Market Conditions
Trend strength indicators measure how strong a trend is, not its direction. This distinction is critical.
Average Directional Index (ADX)
ADX quantifies trend strength on a scale from 0 to 100. Values below 20 indicate weak or no trend, while values above 25 indicate strong trending conditions.
Professionals use ADX to select appropriate strategies. Trend-following systems perform poorly in low-ADX environments, while range-based strategies struggle in high-ADX markets.
Indicator Integration and the Professional Workflow
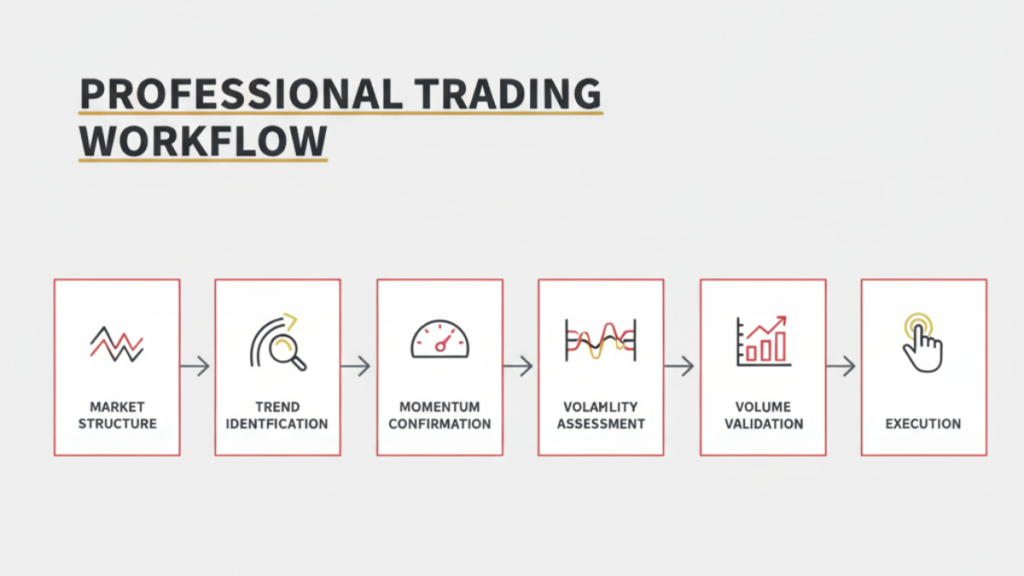
Professional traders do not rely on indicators in isolation. They follow a top-down process that begins with market structure and ends with execution.
This process typically involves identifying market structure, confirming trend direction, measuring momentum, assessing volatility, and validating participation. Indicators support decisions, but they never replace analysis.
Indicator Overload and Its Consequences
One of the most common mistakes traders make is using too many indicators. Excessive indicators create conflicting signals, increase hesitation, and destroy consistency.
Professional traders limit indicators and master interpretation rather than quantity. Simplicity improves execution.
Why Indicators Fail Without Proper Learning
Most indicator misuse comes from random internet learning, lack of market context, and absence of risk frameworks. Traders learn what indicators are, but not how to apply them consistently.
This is why many traders benefit from structured stock market education, such as stock market classes in Jaipur, where indicators are taught alongside price action, risk management, and real market exposure.
Final Conclusion
Technical indicators are analytical tools, not prediction machines. Used correctly, they improve clarity, reduce emotional errors, and support disciplined execution. Used incorrectly, they create dependency, increase losses, and damage confidence.
Mastery comes from understanding behavior, not memorizing settings. Traders who focus on structure, context, and risk management outperform those who chase signals.
Indicators support the process. Discipline sustains the trader. Join Vaishvik Traders, the best stock market institute in Jaipur to learn all the fundamentals about the stock market with live practical classes.