Here’s a statistic that should scare you: 90% of retail traders lose money in the stock market.
Not 50%. Not 60%. Ninety percent.
Think about that. If you put 100 people in a room who start trading today, only 10 will still be profitable a year from now. The rest? They’ll have smaller accounts, blown accounts, or they’ll have quit entirely.
Now here’s the really uncomfortable part: most of those 90 people think they won’t be part of that statistic. They believe they’re different. Smarter. More disciplined.
You might be thinking the same thing right now.
So let me ask you this: if 90% fail, what makes you think you’ll be in the 10%? Luck? Hard work? A good strategy you found on YouTube?
The truth is harder to swallow. Most traders don’t fail because they’re stupid or unlucky. They fail because they make the same mistakes over and over-and the biggest one has nothing to do with picking the wrong stocks.
It’s about risk management. Or rather, the complete lack of it.
The Real Reason Traders Lose Money (It’s Not What You Think)
Go ahead, ask any losing trader why their account is down. Here’s what they’ll say:
“The market is manipulated.” My stock would’ve worked if I held longer.” I got unlucky with a few trades.” The market makers hunt my stop-losses.”
Notice something? It’s never their fault.
But here’s what actually happened: they risked too much, too often, on too many trades. They had no idea how to protect their capital. They confused gambling with trading.
Let me show you what I mean with a real example:
Trader A has ₹1,00,000 in his account. He finds a “sure shot” stock tip. He’s confident-really confident-so he puts ₹40,000 into one trade. That’s 40% of his capital on a single trade.
The stock drops 10% the next day. He just lost ₹4,000.
“It’s okay,” he thinks. “I’ll make it back.” So he puts ₹50,000 into the next trade to recover faster. That one drops 8%. Another ₹4,000 gone.
In just two trades, he’s down ₹8,000-8% of his starting capital. Now he’s desperate. He needs to make back that money fast, so he takes bigger risks. You can guess how this story ends.
Trader B has the same ₹1,00,000. But she never risks more than ₹1,000 (1%) on any single trade. Her first trade loses ₹1,000. Her second trade loses ₹1,000. Even her third trade loses ₹1,000.
She’s taken three losses in a row, but she’s only down 3%. Her account? Still ₹97,000. She’s completely fine, emotionally calm, and ready for the next trade.
See the difference? It’s not about being right or wrong. It’s about how much damage being wrong can do to your account.
The 7 Risk Management Mistakes That Kill Accounts
Let’s get specific. Here are the exact mistakes that put you in the 90% category:
Mistake #1: Risking Too Much Per Trade
This is the big one. The account killer.
New traders regularly risk 5%, 10%, even 20% of their capital on a single trade. They think: “I’m confident in this one, so I’ll go big.”
Here’s the math that destroys them:
If you risk 10% per trade and lose five trades in a row (which will happen, trust me), you’re down 40%. To make back that 40%, you now need a 67% return. Good luck with that.
But if you risk 1% per trade and lose five trades in a row, you’re down 5%. To recover, you need just 5.3% return. Totally manageable.
The rule: Never risk more than 1-2% of your capital on any single trade. Period.
I don’t care how confident you are. I don’t care if your cousin’s friend’s brother made ₹50,000 on this stock yesterday. Stick to 1-2%.
Mistake #2: Not Using Stop-Losses (Or Moving Them)
“Stop-losses are for weak traders. I believe in my analysis.”
This is what broke traders say.
Here’s what happens: you buy a stock at ₹500. Your plan says sell at ₹480 if it drops. It hits ₹480. But instead of selling, you think “it’ll bounce back.” It drops to ₹460. “Now it’s definitely a good buy,” you convince yourself.
Before you know it, you’re holding a stock at ₹420, and what was supposed to be a 4% loss is now a 16% loss.
The truth: Every winning trader uses stop-losses. Every single one. The difference between professionals and amateurs isn’t that pros don’t lose-it’s that when they lose, they lose small.
Set your stop-loss before you enter the trade. And when it hits, exit. No excuses, no “just one more day.”
Mistake #3: Over-Trading (The Addiction Nobody Talks About)
You’re not a day trader. You’re an action junkie.
You open 10 trades a day. Some days 15. You can’t just sit and watch the market—you need to be IN the market. Every red candle feels like a missed opportunity. Every green candle makes you FOMO.
Here’s what you don’t realize: every trade has a cost. Brokerage, STT, GST, exchange charges. On a ₹10,000 trade, you might pay ₹50-100 in charges. Do that 20 times, and you’ve spent ₹1,000-2,000 before you even consider if your trades were profitable.
Plus, more trades = more opportunities to be wrong.
The reality check: Professional traders often take 2-5 trades per week, not per day. They wait for high-probability setups. You should too.
Mistake #4: Revenge Trading (Emotional Account Suicide)
You lose a trade. It stings. You’re frustrated, maybe a little angry. So what do you do?
You jump into the next trade immediately to “make it back.” You don’t even analyze properly—you just need to win. To feel better. To prove you’re not a loser.
This is revenge trading, and it’s an account killer.
Why? Because you’re trading your emotions, not your strategy. You’re not following your plan; you’re chasing a feeling. And the market doesn’t care about your feelings.
What to do instead: Have a rule. After any loss, step away for at least 30 minutes. Go for a walk, grab coffee, do anything except take another trade. Let the emotion settle, then come back with a clear head.
Mistake #5: Position Sizing Based on “Confidence”
“I’m really confident about this stock, so I’ll buy 200 shares instead of my usual 100.”
This sounds logical, but it’s a trap.
Your confidence means nothing to the market. The stock doesn’t know you believe in it. The stock doesn’t care that you spent three hours analyzing it.
What happens when your “high confidence” trade loses? You lose twice as much as normal. And your confidence? Shattered.
The rule: Position size should be based on your risk per trade (1-2% of capital), NOT your confidence level. Every trade gets the same risk allocation, regardless of how sure you feel.
Mistake #6: Not Having a Trading Plan
Most losing traders trade like this:
- See a stock moving up → Buy
- Stock drops → Panic
- Decide randomly whether to hold or sell
- Repeat
There’s no plan. No rules. No predetermined exit points. Just pure reaction to whatever the market does.
Compare that to a winning trader:
- Waits for specific setup (e.g., breakout above resistance with volume)
- Enters at predetermined price
- Sets stop-loss at logical level (below support)
- Sets target based on risk-reward ratio (minimum 1:2)
- Follows the plan regardless of emotions
The difference: One is gambling. The other is trading.
Mistake #7: Ignoring Risk-Reward Ratio
Here’s a question: Would you risk ₹1,000 to make ₹500?
Obviously not, right? That’s a terrible deal.
Yet traders do this all the time without realizing it. They buy a stock at ₹100, set a stop-loss at ₹95 (₹5 risk per share), and set a target at ₹103 (₹3 profit per share).
That’s risking ₹5 to make ₹3. Over the long term, even with a 50% win rate, you’ll lose money.
The minimum standard: Your potential reward should be at least 2x your risk. Risk ₹1,000? Your target should be ₹2,000 minimum.
Better traders aim for 1:3 or even 1:4 risk-reward ratios. This means you can be wrong 60% of the time and still make money.
The Real Numbers: Why 1% Risk Changes Everything
Let’s do the math that separates the 10% from the 90%.
Scenario 1: Risking 10% per trade
- Starting capital: ₹1,00,000
- Win rate: 50% (pretty good!)
- Risk-reward: 1:1 (₹10,000 risk for ₹10,000 reward)
After 10 trades (5 wins, 5 losses): You’re at ₹1,00,000. Break even.
But here’s the problem: One bad streak of 4 losses in a row, and you’re down ₹34,000. To recover that, you need a 52% return. And psychologically? You’re devastated.
Scenario 2: Risking 1% per trade
- Starting capital: ₹1,00,000
- Win rate: 50% (same)
- Risk-reward: 1:2 (₹1,000 risk for ₹2,000 reward)
After 10 trades (5 wins, 5 losses): You’re at ₹1,05,000. Up 5%.
Even with a bad streak of 4 losses in a row, you’re only down ₹4,000 (4%). Easy to recover. Easy to stay calm. Easy to keep following your plan.
See the magic? Lower risk per trade + better risk-reward ratio = consistent profits.
What the 10% Do Differently
The traders who survive and thrive aren’t smarter than you. They don’t have secret indicators or insider information.
They just follow rules that protect their capital:
1. They risk 1-2% maximum per trade. No exceptions. Ever.
2. They use stop-losses religiously. They exit when they’re wrong, quickly and without ego.
3. They keep a trading journal. They track every trade—entry, exit, reason, emotion, result. Then they review it weekly to spot patterns.
4. They understand that losses are part of the game. They don’t revenge trade. They don’t get emotional. A loss is just data.
5. They focus on process, not results. They know that if they follow their plan consistently, profits will come.
6. They never trade with money they can’t afford to lose. Rent money, loan money, emergency fund? Never touches the trading account.
7. They have realistic expectations. They’re not trying to double their account in a month. They’re aiming for 2-5% monthly returns consistently.
The Uncomfortable Truth You Need to Hear
You want to know why you’ll probably be in the 90%?
Because you’ll read this article, nod along, maybe even save it—and then do exactly what you were doing before.
You’ll risk 5% on your next trade because “this one is different.” You’ll skip the stop-loss because “you have a good feeling.” You’ll overtrade because you “see opportunities everywhere.” You’ll revenge trade because “you need to make back that loss.”
And six months from now, you’ll be wondering why your account is smaller than when you started.
Here’s the alternative: Take risk management seriously. Right now. Not after you blow up your first account. Not after you lose ₹50,000. Now.
Because the market doesn’t care about your potential. It doesn’t care that you’re smart or hardworking. It only cares about one thing: Can you protect your capital?
If you can’t, you’re gone. If you can, you get to stay in the game long enough to actually become good at this.
Your Action Plan (Starting Today)
Stop reading articles about “best stocks to buy” or “secret indicators that work.” Start here:
Step 1: Calculate your risk per trade. Take your account size, multiply by 0.01 (1%). That’s your maximum risk per trade. Write it down.
Step 2: Before your next trade, determine your entry, stop-loss, and target. Calculate your position size so that if your stop-loss hits, you lose exactly 1% of your account. Not 2%, not 5%—exactly 1%.
Step 3: Place the stop-loss order immediately after entering the trade. Not “mentally.” An actual stop-loss order in your trading platform.
Step 4: Keep a simple journal. For every trade, note: Date, stock, entry price, exit price, profit/loss, and most importantly—did you follow your plan?
Step 5: Review your trades weekly. Not daily (too emotional). Weekly. Look for patterns. Are you breaking your rules? When? Why?
Do this for 50 trades. Just 50. Track everything. Follow your rules. Risk 1% maximum.
After 50 trades, you’ll either be profitable or breaking even. But more importantly, you’ll still have capital left to improve. You won’t be part of the 90% who blew up their accounts and quit.
The Choice is Yours
The stock market is one of the few places where you can genuinely build wealth with relatively small starting capital. But it’s also one of the few places where you can lose everything if you don’t respect risk.
90% of traders lose money. But it’s not because the market is rigged or because trading doesn’t work.
It’s because they treat their trading account like a casino. They risk too much, too fast, on too many trades.
The 10% who succeed? They’re boring. They risk small. They follow rules. They track results. They protect capital like it’s their job—because it is.
You can be part of the 10%. But only if you stop trying to get rich quick and start trying to not go broke.
The market will be here tomorrow, next month, next year. The question is: Will you?
Master Risk Management with Expert Guidance
At Vaishvik Trader, we don’t just teach you how to pick stocks—we teach you how to survive and thrive in the markets. Our programs emphasize risk management, position sizing, and trading psychology because we know these are what separate winners from losers.
Whether you’re a complete beginner or struggling to become consistently profitable, our live market training will help you develop the discipline and skills you need.
Visit our institute in Jaipur or explore our online courses to learn trading the right way—with risk management at the core.
Let me guess-you’ve watched a few YouTube videos about trading, and now you’re confused.
One guru swears by intraday trading: “Make quick profits every single day!” Another says swing trading is the only way: “Less stress, better returns!” Meanwhile, you’re sitting there wondering which one you should actually do.
Here’s the truth nobody wants to tell you: there is no “better” style. There’s only what fits your life, your personality, and your goals.
Let’s break down both approaches honestly-no hype, no BS-so you can figure out which one actually makes sense for you.
What is Intraday Trading?
Intraday trading means buying and selling stocks within the same day. You open a position in the morning, and you close it before the market shuts at 3:30 PM. No overnight risk, no carrying positions forward.
A typical intraday trade looks like this:
You spot a bullish pattern on Reliance at 10:15 AM. Stock is at ₹2,850. You buy 100 shares. By 2:00 PM, it hits ₹2,870. You book your profit of ₹2,000 and you’re done for the day.
Simple, right? Well, sort of.
The Reality of Intraday Trading
Here’s what the YouTube videos don’t show you:
You need to be glued to your screen. We’re talking 9:15 AM to 3:30 PM, watching charts, monitoring positions, ready to act within seconds. Miss a crucial movement because you were in a meeting? That’s a potential loss.
The stress is real. When you’re in a losing trade and it’s 3:15 PM, you have 15 minutes to decide: cut the loss now or hope for a miracle? That pressure gets to people.
You’re fighting against professional traders. The people on the other side of your trade? Many of them have been doing this for years, with better tools, faster execution, and algorithms you can’t compete with.
But here’s the upside: when you close your laptop at 3:30 PM, you’re completely out. No worrying about what happens overnight. No waking up to gap-down openings that wipe out your profits.
What is Swing Trading?
Swing trading means holding positions for days or weeks to catch larger price movements. You’re not trying to make money every day-you’re waiting for the right setup, entering, and letting the trade play out over time.
A typical swing trade looks like this:
You analyze TCS and spot a potential breakout setup. On Monday, you buy at ₹3,500. You hold through the week. By next Monday, it’s at ₹3,650. You exit with a ₹15,000 profit on 100 shares.
The Reality of Swing Trading
Swing trading sounds relaxed, but it has its own challenges.
You carry overnight risk. Markets can gap down due to global events, policy changes, or company news. You might go to sleep with a 2% profit and wake up to a 5% loss.
You need patience. A lot of it. Your trade setup might take 5-7 days to play out. During that time, the stock might go against you before moving in your favor. Can you handle watching your position in the red for three days straight?
Capital gets locked. If you put ₹1,00,000 in a swing trade, that money is tied up for days or weeks. You can’t use it for other opportunities until you exit.
But here’s the benefit: you’re not watching charts all day. You check your positions morning and evening, set your stop-losses, and go about your life. You can have a full-time job and still swing trade effectively.
The Honest Comparison: What Nobody Tells You
Let me break down the real differences that matter:
Time Commitment
Intraday: You need 6+ hours of focused screen time daily. If you have a 9-to-5 job, intraday trading is nearly impossible unless you’re willing to trade during work hours (not recommended).
Swing Trading: 30-60 minutes daily for analysis and monitoring. You can easily do this before work or in the evening.
Winner for working professionals: Swing trading, hands down.
Stress Levels
Intraday: High stress. Every minute matters. You’re making quick decisions under pressure multiple times a day.
Swing Trading: Moderate stress. The anxiety comes from overnight gaps and waiting for your setup to play out, but you’re not making split-second decisions.
Winner for peace of mind: Swing trading.
Capital Requirements
Here’s where it gets interesting.
Intraday: Brokers give you margin (leverage). With ₹25,000, you can take positions worth ₹1,00,000 or more. Sounds great until you realize that leverage magnifies losses too.
Swing Trading: No intraday margin. You need the full capital for your positions. However, you’re not using risky leverage.
Winner: Depends on your risk tolerance. Intraday offers more buying power, but swing trading is safer.
Profit Potential
This is where people get it completely wrong.
Intraday traders aim for: 0.5% to 2% per trade. On a ₹50,000 position, that’s ₹250 to ₹1,000 per trade. Do this successfully 15-20 times a month, and you’re looking at ₹15,000-20,000.
Swing traders aim for: 3% to 8% per trade. On a ₹50,000 position, that’s ₹1,500 to ₹4,000 per trade. Catch 3-4 good trades a month, and you’re also at ₹15,000-20,000.
See the point? Both can make similar returns. The difference is how you get there-many small wins vs. fewer larger wins.
Win Rate Reality
Intraday: You might win 40-50% of your trades. Yes, less than half. But your winners are managed with tight risk-reward ratios (risk ₹500 to make ₹1,000).
Swing Trading: Win rates can be 50-60% because you’re waiting for clearer setups. But when you’re wrong, you might lose more per trade.
Which Trading Style Fits Your Life?
Stop thinking about which is “better” and start thinking about which fits YOU.
You Should Consider Intraday Trading If:
- You can dedicate full trading hours (9:15 AM – 3:30 PM)
- You thrive under pressure and can make quick decisions
- You want to sleep peacefully without positions overnight
- You have good emotional control (can take multiple losses without revenge trading)
- You’re okay with smaller profit targets per trade
- You genuinely enjoy watching charts and market action
You Should Consider Swing Trading If:
- You have a full-time job or business
- You prefer analysis over rapid execution
- You can handle overnight market risk
- You have the patience to let trades develop over days
- You want a trading style that doesn’t consume your entire day
- You’re comfortable with capital being locked for longer periods
The Biggest Mistake Beginners Make
Here’s what happens to most new traders:
They start with intraday because it sounds exciting. “Make money every day!” They watch videos of traders showing ₹5,000 profit in 30 minutes. It looks easy.
Then reality hits. They’re staring at charts all day, missing entries, exiting too early, holding losers too long. Within a month, they’ve made 20 trades, won 6, and lost more money than they made.
So they switch to swing trading. “I need to be more patient,” they think. They enter a trade, and it goes against them the next day. They panic and exit. Then the stock does exactly what they predicted-just after they got out.
The real problem? They never gave either style a fair chance. They kept switching strategies instead of mastering one.
My Honest Recommendation for Beginners
Start with swing trading. Here’s why:
1. It’s more forgiving. You have time to think, analyze, and make decisions. Intraday trading punishes hesitation instantly.
2. You can learn while working. Most beginners can’t quit their jobs to trade full-time. Swing trading lets you learn without sacrificing income.
3. Better for building discipline. Swing trading teaches you patience, proper analysis, and risk management-skills that work in any trading style.
4. Lower transaction costs. Fewer trades mean lower brokerage and taxes. This matters more than you think.
5. Less emotional damage. Taking 10 losses in a day (intraday) is psychologically harder than taking 2 losses in a month (swing).
Once you’re consistently profitable with swing trading for 6-12 months, then consider if intraday fits your personality and schedule.
Can You Do Both?
Yes, but not when you’re starting out.
Some experienced traders use swing trading for their core positions and do selective intraday trades for extra income. But this requires mastering both styles separately first.
Trying to do both as a beginner is like learning to drive a car and a motorcycle simultaneously. You’ll probably crash both.
What You Should Actually Do Right Now
Forget about which is “better.” Here’s your action plan:
Step 1: Be honest about your availability. Can you watch markets for 6 hours daily? If no, swing trading is your answer.
Step 2: Paper trade (demo trade) your chosen style for at least 2-3 months. Track every trade, note what works, what doesn’t.
Step 3: Start with real money using the smallest position size possible. If you’re swing trading, maybe 10-20 shares per trade. If intraday, the minimum lot size.
Step 4: Master one strategy within your chosen style. Don’t jump around. Stick with one approach for at least 50 trades.
Step 5: Review monthly. Are you following your rules? Are you improving? Is this style truly sustainable for your lifestyle?
The Real Success Formula
Here’s what separates profitable traders from everyone else-and it has nothing to do with intraday vs. swing:
Consistency beats intensity. A swing trader who makes 5% monthly for 12 months (60% annually) will massively outperform an intraday trader who makes 15% some months and loses 10% others.
Risk management is everything. Whether you’re trading intraday or swing, if you risk more than 1-2% per trade, you’ll eventually blow up your account.
Your personality matters more than the strategy. An anxious person trying intraday trading will suffer. An impatient person trying swing trading will sabotage their own trades.
The Bottom Line
Intraday trading isn’t more profitable than swing trading. Swing trading isn’t easier than intraday. They’re different tools for different people.
The question isn’t “Which is better?” It’s “Which matches my life, my temperament, and my goals?”
If you’re working full-time, swing trading makes sense. If you can dedicate full market hours and handle pressure well, intraday might work. If you’re still not sure, start with swing trading—it’s the safer path for beginners.
But whatever you choose, commit to it. Give it a real chance. Track your trades, follow your rules, and give yourself at least 100 trades before judging if it works.
Trading success isn’t about finding the perfect style. It’s about mastering whichever style fits your life and sticking with it long enough to see results.
The markets will be here tomorrow, next month, next year. Take your time, choose wisely, and build skills that last.
Learn to Trade the Right Way
At Vaishvik Trader, we teach both intraday and swing trading strategies based on what fits YOUR goals and lifestyle. Our programs include live market sessions, practical risk management techniques, and personalized guidance to help you become a consistently profitable trader.
Whether you’re a working professional looking to swing trade or someone ready to commit to intraday trading full-time, we’ll help you build the skills and discipline you need.
Visit our institute in Jaipur or explore our online programs to start your trading journey with the right foundation.https://vaishviktrader.com/
You’ve been crushing it in your demo account. Three winning trades in a row, your virtual balance is up 15%, and you’re feeling invincible. So naturally, you’re thinking: “It’s time to trade with real money.”
But here’s the thing—most traders who rush this decision end up regretting it.
The question isn’t whether you’ll eventually switch to real trading (you will), but when you should make that jump. Get the timing wrong, and you might blow through your capital before you even understand what went wrong.
Let’s talk about the real differences between paper trading and live trading, and more importantly, when you’re actually ready to put your money on the line.
What is Paper Trading? (And Why It’s Not What You Think)
Paper trading is practicing stock trading with virtual money. You execute real trades on live market data, but without any actual financial risk. Think of it as a flight simulator for traders.
Most brokers in India—Zerodha, Upstox, Angel One—offer paper trading platforms. You get the same charts, the same order types, and the same market movements. The only difference? The money isn’t real.
Sounds perfect, right? Well, not exactly.
The Brutal Truth About Paper Trading
Here’s what nobody tells you: paper trading creates a false sense of confidence.
When you’re trading with virtual money, your brain knows there’s no real consequence. You might follow your strategy perfectly, or you might take a risky trade just to “see what happens.” Either way, your emotions aren’t truly engaged.
Paper trading can teach you:
- How to place orders and use your trading platform
- Basic technical analysis and chart patterns
- How to calculate position sizes and stop losses
- The mechanics of different order types (market, limit, stop-loss)
Paper trading cannot teach you:
- How you’ll react when you see your actual money disappearing
- The anxiety of holding a losing position overnight
- The temptation to move your stop-loss when a trade goes against you
- The rush of greed when a winning trade makes you want to add more size
That last part is critical. Trading psychology is responsible for more losses than bad strategies ever will be.
Real Trading: Where Everything Changes
I’ve seen traders with perfect paper trading records lose money in their first month of real trading. Not because their strategy stopped working, but because they started behaving differently.
When it’s your real ₹50,000 in the market, everything feels different:
The fear hits harder. You second-guess your entry. You exit winning trades too early. You freeze when you should cut losses.
The greed is stronger. You overtrade to “make back” a loss. You risk too much on a single trade. You abandon your plan for a “sure thing.”
The discipline disappears. Rules you followed religiously in demo? Suddenly negotiable when real money is involved.
This isn’t a character flaw—it’s human nature. Your brain treats real losses very differently than virtual ones.
So When Should You Actually Make the Switch?
Forget arbitrary timelines like “trade on demo for 3 months.” That’s useless advice. Some people are ready in a month; others need six months or more.
Instead, ask yourself these questions:
1. Can You Follow Your Trading Plan Consistently?
Look at your last 30 paper trades. Did you follow your entry rules every single time? Did you stick to your stop-losses? Did you exit at your target or based on your strategy?
If you’re still taking random trades or moving your stops because “this time is different,” you’re not ready.
2. Are You Profitable Over at Least 50-100 Trades?
One good week doesn’t mean anything. Markets change, and you need to see if your strategy works across different conditions—trending days, choppy days, high volatility, low volatility.
Track your win rate, average profit, average loss, and risk-reward ratio. If you don’t even know these numbers, you’re definitely not ready.
3. Do You Understand WHY You Win or Lose?
This is huge. Most beginners can’t explain why their last trade worked or failed beyond “the chart went up” or “I got unlucky.”
If you can’t articulate the exact reason for each win and loss, you’re going to repeat your mistakes with real money.
4. Have You Stress-Tested Your Psychology?
Here’s a simple test: After a losing trade in paper trading, do you immediately want to take another trade to “win it back”? Do you feel frustrated, angry, or anxious?
If yes, imagine how much worse that will feel with real money. You need to handle demo losses with complete emotional control before risking actual capital.
The Bridge Between Paper and Real: Start Small
When you do decide to make the switch, don’t jump in with your full capital. This is where most beginners blow up their accounts.
Start with an amount that feels meaningful but not devastating if you lose it.
For most Indian traders, this means starting with ₹10,000-25,000. Not ₹5,000 (too small to feel real), and definitely not ₹2,00,000 (too much pressure).
The goal of your first few months in real trading isn’t to make money—it’s to learn how you behave with real money at stake.
The Transition Strategy
Week 1-2: Take only one trade per day maximum, using the smallest position size possible. Focus entirely on execution and following your rules.
Week 3-4: Gradually increase to 2-3 trades per day if your first trades followed your plan exactly.
Month 2-3: Slowly increase position size, but never risk more than 1% of your capital on a single trade.
If at any point you break your rules or feel overwhelmed emotionally, scale back down. There’s no shame in it—in fact, it shows maturity as a trader.
The Biggest Mistake Beginners Make
Want to know the fastest way to fail at real trading?
Switching to live trading after one good month in demo, with no trading plan, using money you can’t afford to lose, while trying to make a living from trading immediately.
I’ve seen this happen dozens of times. Smart people, convinced they’ve figured out the markets, depositing their entire savings and planning their resignation letter.
Then reality hits. The first real loss feels different. They panic. They overtrade to recover. Within weeks, sometimes days, a significant chunk of their capital is gone.
Don’t be that person.
What You Should Actually Do
If you’re in paper trading right now, treat it seriously. Don’t take trades you wouldn’t take with real money. Don’t ignore your stop-losses. Don’t check your account every five minutes just because there’s no consequence.
Develop the discipline now, in an environment where mistakes are free.
Then, when you switch to real trading:
- Start with capital you can afford to lose completely
- Trade the smallest size possible initially
- Keep a detailed journal of every trade and your emotions
- Have a specific plan for when you’ll scale up (hint: not after one winning day)
- Accept that your first few months might be breakeven or slightly negative—that’s actually a win if you’re learning
The Real Goal: Becoming a Consistent Trader
Here’s something most trading educators won’t tell you: the vast majority of retail traders lose money, especially in the first year.
But the ones who succeed? They’re not necessarily smarter or luckier. They’re just more patient with their own learning curve.
They spent enough time in paper trading to develop real skills. They transitioned to real trading slowly and deliberately. They treated their first year as an expensive education, not a get-rich-quick scheme.
If you’re serious about trading, you’ll eventually need to use real money. Markets reward those who can handle pressure, manage risk, and control their emotions.
But there’s no rush. The markets will be here tomorrow, next month, next year.
Take your time in paper trading. Learn the skills. Build the discipline. And when you do make the switch, do it with a plan, proper risk management, and realistic expectations.
Your future self—and your bank account—will thank you.
Ready to Take Your Trading to the Next Level?
At Vaishvik Trader, we help beginners bridge the gap between paper trading and real trading success. Our live market training programs focus on practical strategies, risk management, and the psychology of trading—the things that actually matter when your money is on the line.
Whether you’re just starting with paper trading or ready to transition to real markets, we provide the guidance and support you need to trade with confidence.
Visit us in Jaipur or join our online programs to start your trading journey the right way.https://vaishviktrader.com/
The artificial intelligence revolution isn’t just changing technology – it’s transforming stock markets worldwide. While U.S. tech giants like Nvidia and Microsoft grab headlines with record-breaking gains, Indian traders are asking: Should I jump into AI stocks, or am I too late to the party?
Let’s cut through the hype and look at what’s really happening in AI markets, how Indian traders can participate, and whether this boom is an opportunity or a trap for beginners.
The Global AI Stock Boom: What’s Driving It?
Microsoft’s Azure cloud services revenue jumped 40% year-over-year, driven by generative AI demand. Nvidia trades at a forward price-earnings ratio of 42.1, while analysts project 36% upside potential. Some analysts believe Nvidia could reach a $6 trillion market capitalization by the end of 2026.
The numbers tell a clear story: AI isn’t hype anymore—it’s driving real revenue growth.
Here’s what’s fueling the fire:
Hardware Infrastructure Boom: Companies need massive computing power to train AI models. Nvidia dominates the AI chip market with GPUs powering most training and inference systems. Demand is so strong that supply can’t keep up, even with billion-dollar production expansions.
Cloud Services Explosion: Microsoft integrates AI across Azure, Office suite, and enterprise tools, offering multiple revenue channels. Every company wanting to use AI needs cloud infrastructure, creating a recurring revenue goldmine for providers.
Enterprise AI Adoption: Palantir posted sales of $1.18 billion with a net income of $475.6 million in Q3 2025. Businesses aren’t just experimenting anymore—they’re deploying AI systems that directly impact their bottom line.
Real Revenue, Not Just Promises: CoreWeave went from minimal sales in 2022 to $1.9 billion in 2024 and is expected to generate more than $10 billion in revenue in 2026. These aren’t hypothetical projections—companies are seeing explosive growth right now.
The AI infrastructure build-out is creating wealth at a pace we haven’t seen since the early days of the internet.
The Indian IT Reality Check: Why Our Stocks Are Struggling
Now here’s the uncomfortable truth Indian traders need to face: while global AI stocks soar, Indian IT companies are getting hammered.
The February 2026 Crash: Indian IT stocks came under heavy pressure on February 4 as a global tech selloff weighed on investor sentiment, with the Nifty IT index down over 7%. Infosys saw its shares plunge over 8%, marking its steepest single-day fall in more than two and a half years. The fall wiped out nearly ₹2 lakh crore in market capitalisation from India’s leading IT companies in a single session.
What triggered this bloodbath?
Anthropic recently launched plug-ins for its Claude Cowork agent, designed to automate tasks across legal, sales, marketing and data analysis functions. These are exactly the kinds of services that Indian IT companies have been selling for decades.
The market’s message was brutal: If AI can automate these tasks, why do we need thousands of Indian engineers doing them manually?
The “SaaSpocalypse” Fear: The term refers to a market fear that AI will replace software-as-a-service and IT service companies rather than just helping them, leading to a collapse in traditional business models.
But Is the Fear Justified?
Tech Mahindra CEO Mohit Joshi dismissed the market response as a “clear overreaction”. Analysts from Nirmal Bang noted that new technology or plug-ins cannot immediately replace old technology debt and a bridge is needed which is provided by companies like Indian IT firms.
The reality is nuanced. Indian IT companies aren’t going extinct overnight, but they’re facing a fundamental business model threat. The era of linear growth linked to headcount is likely ending. Companies like TCS and Infosys must now focus on selling results rather than hours.
The Recovery Outlook: Motilal Oswal forecasts AI services demand to experience a meaningful uplift starting mid-2026 as hardware-led AI capital expenditure moderates and spending shifts towards software, platforms, and associated services.
So there’s hope – but only for IT companies that successfully pivot to selling AI-powered solutions instead of just providing bodies.
How Indian Traders Can Access Global AI Stocks
If you want exposure to the real AI revolution – not just companies hoping to survive it – you need access to U.S. markets. Here’s how:
Option 1: Direct U.S. Stock Investment (Most Recommended)
Platforms like INDmoney, Winvesta, and Vested allow you to invest directly in U.S. stocks.
The process:
- Open an account (15-minute digital KYC with PAN and Aadhaar)
- Fill out Form W-8BEN (reduces dividend tax from 30% to 25%)
- Transfer money using RBI’s Liberalised Remittance Scheme (LRS) – up to $250,000 per year
- Start buying! You can purchase fractional shares, so you don’t need ₹1 lakh to buy one Nvidia share
Advantage: Direct ownership of shares, full exposure to U.S. market performance, ability to hold long-term
Considerations: You’ll pay 12.5% tax on long-term capital gains in India (after 2 years) plus currency conversion costs
Option 2: AI-Focused ETFs
If picking individual stocks feels overwhelming, AI-themed ETFs give you diversified exposure.
Popular options accessible to Indian investors:
- Invesco QQQ (tracks Nasdaq-100, includes top AI companies)
- Various AI-specific ETFs through platforms like INDmoney
Advantage: Instant diversification, professional management, less research required
Disadvantage: ETF fees, less control over individual holdings
Option 3: Indian Mutual Funds with U.S. Exposure
Some Indian mutual funds invest in international stocks, giving you indirect U.S. market access.
Advantage: No LRS paperwork, rupee-based investing, familiar process
Disadvantage: Limited AI-specific exposure, taxed as debt funds in India, higher expense ratios
Option 4: GIFT City NSE IFSC (Unsponsored Depository Receipts)
The NSE International Exchange in GIFT City offers “receipts” of major U.S. stocks.
Advantage: India-regulated, no LRS hassle for small amounts
Disadvantage: Limited stock selection, lower liquidity than direct U.S. investing
The Top 5 AI Stocks for Indian Traders in 2026
Based on analyst consensus and market position, here are the most compelling AI plays:
1. Nvidia (NVDA) – The AI Infrastructure King
Nvidia commands a market valuation of $4.6 trillion and trades at a forward price-earnings ratio of 42.1. Based on the estimates of 48 analysts, Nvidia commands a “Strong Buy” rating with a mean price target of $256 implying an upside potential of 36.1%.
Why it matters: Nvidia’s GPUs are the pick-and-shovels of the AI gold rush. Every company building AI models needs their chips.
Risk: High valuation, competition from AMD and custom chips by cloud providers
2. Microsoft (MSFT) – The AI Everything Company
Microsoft has a $625 price target with +28% upside and integrates AI across Azure, Office suite, and enterprise tools. From fiscal 2025 to fiscal 2028, analysts expect Microsoft’s revenue and EPS to grow at CAGRs of 47% and 45%.
Why it matters: Microsoft’s OpenAI partnership gives it first-mover advantage in enterprise AI. Copilot is already generating billions in recurring revenue.
Risk: Dependence on OpenAI relationship, intense competition
3. Alphabet/Google (GOOGL) – The AI Data Giant
Alphabet’s forward P/E ratio is hovering around 28 and the company is on the cusp of unlocking a new wave of growth in cloud infrastructure.
Why it matters: Google has more data than anyone and has been doing AI longer than most. Their custom TPU chips reduce dependence on Nvidia.
Risk: Regulatory pressures, search disruption concerns
4. Palantir (PLTR) – The Enterprise AI Software Play
Palantir has a $230 price target with +25% upside and focuses on AI platforms for government and enterprise clients.
Why it matters: Palantir sells AI that actually does work—analyzing data for defense agencies and Fortune 500 companies.
Risk: High valuation, customer concentration, execution risk
5. CoreWeave (CRWV) – The Pure-Play AI Infrastructure Bet
CoreWeave is expected to generate more than $10 billion in revenue in 2026, growing from minimal sales in 2022.
Why it matters: Pure exposure to AI infrastructure demand without the baggage of legacy businesses.
Risk: Microsoft accounted for 62% of revenue in 2024, and the company carries heavy debt and large capital expenditures. This is a high-risk, high-reward play.
Should You Also Consider Indian AI Stocks?
While Indian IT stocks face challenges, some companies are genuinely pivoting to AI:
TCS, Infosys, HCL Tech – For large-cap companies, Motilal Oswal’s preferred picks are Infosys and Tech Mahindra. These companies have strong balance sheets and are investing heavily in AI capabilities.
The case for Indian AI stocks:
- Cheaper valuations after the recent crash
- Government support through National AI Mission
- Talent pool and cost advantage
- Recovering demand expected from mid-2026
The case against:
- Business model disruption risk
- Slower adoption of AI compared to building it
- Lower margins as services get commoditized
Bottom line: Indian IT stocks might recover, but they’re defensive plays, not growth plays. If you want AI exposure for growth, look global.
Beginner Mistakes to Avoid with AI Stocks
1. Chasing Headlines Without Understanding the Business Just because a company mentions “AI” doesn’t make it an AI stock. Many companies slap “AI-powered” on marketing materials without real AI revenue.
2. Ignoring Valuation Completely Yes, AI is the future. No, that doesn’t mean any price is justified. NVDA stock trades at a forward PE ratio of 42.1 but also has a price-earnings-to-growth ratio of 0.91, indicating valuations remain attractive. Always check if growth justifies the premium.
3. Going All-In on One Stock Even Nvidia could stumble. Diversify across the AI stack—chips, cloud, software, applications.
4. Panic-Selling During Corrections AI stocks took a hit on news about the Chinese AI lab DeepSeek in late January 2025 and tariffs in April. Every growth sector has volatility. If the fundamentals are intact, use dips to add positions.
5. Forgetting Currency Risk Your returns in U.S. stocks depend on both stock performance and USD/INR exchange rates. The rupee has historically depreciated 3-5% annually against the dollar – which actually helps your returns when converting back to rupees!
6. Not Understanding Tax Implications Long-term capital gains (held >2 years) on U.S. stocks are taxed at 12.5% in India without indexation. Plan accordingly.
The Verdict: Should You Join the AI Party?
Yes, but with realistic expectations.
The AI revolution is real. Companies are spending hundreds of billions building AI infrastructure, and that money is flowing to the picks-and-shovels providers—chip makers, cloud platforms, and infrastructure companies.
Indian traders who want growth exposure should absolutely consider global AI stocks, but not at the expense of a diversified portfolio.
A balanced approach for beginners:
- 60% Core Portfolio: Solid Indian blue-chips and index funds
- 25% Growth Allocation: U.S. AI stocks (mix of individual stocks and ETFs)
- 15% Opportunistic Plays: Indian IT stocks at current depressed valuations (if you believe in the recovery thesis)
For more aggressive traders:
- Increase U.S. AI allocation to 40-50%
- Focus on leaders (Nvidia, Microsoft, Alphabet)
- Add smaller positions in high-growth plays like CoreWeave or Palantir
The AI boom isn’t over—it’s just getting started. The strongest opportunities in 2026 are coming from the companies building and deploying AI at scale.
But remember: you’re not investing in AI. You’re investing in companies that profit from AI. Know what you own, understand the risks, and never invest money you can’t afford to lose.
Ready to Start Trading?
At Vaishvik Traders, we teach you not just what to trade, but how to think like a successful trader. Our courses cover:
- Global market analysis (including U.S. markets)
- Fundamental analysis for evaluating growth stocks
- Technical analysis for timing your entries and exits
- Risk management to protect your capital
Whether you’re interested in Indian stocks, U.S. AI stocks, or forex trading, we give you the skills to make informed decisions.
Book your free demo class and learn how to participate in global market opportunities—the right way.
Disclaimer: This article is for educational purposes only and does not constitute investment advice. Always conduct your own research and consult with a qualified financial advisor before making investment decisions. Past performance does not guarantee future results.
Finance Minister Nirmala Sitharaman presented her historic 9th consecutive Union Budget on February 1, 2026 – marking the first time in India’s history that a budget was presented on a Sunday. For traders and investors, this budget brings both unprecedented opportunities and significant challenges. Here’s your complete guide to navigating the post-budget market landscape.
The Big Picture: What Changed?
The Union Budget 2026-27 outlined a massive ₹53.5 lakh crore total expenditure with a fiscal deficit target of 4.3% of GDP. The government is scaling up public capital expenditure to ₹12.2 lakh crore, representing the highest capex allocation as a percentage of GDP in at least a decade.
However, markets reacted negatively on Budget Day, with the Sensex crashing 1,547 points and the Nifty falling 495 points. Investor wealth worth ₹10 lakh crore was wiped out in a single session. The primary culprit? An unexpected hike in Securities Transaction Tax (STT) on derivatives trading.
The STT Shock: What Traders Need to Know
The budget increased STT rates significantly:
- Futures: Increased from 0.02% to 0.05% (a 150% hike)
- Options: Increased from 0.10% to 0.15% (a 50% hike)
These changes take effect from April 1, 2026, and are aimed at curbing excessive retail speculation. For active traders, this means higher transaction costs and potentially lower profitability on short-term trades.
The Income Tax Department justified this move by citing that F&O transaction volumes are now more than 500 times India’s GDP — a clear sign of excessive speculation in the government’s view.
Winners: Sectors Poised to Rally
1. Infrastructure & Construction (High Confidence)
Why They’ll Rally: The budget allocated ₹12.2 lakh crore for capital expenditure, with a broader infrastructure package estimated at nearly $133 billion.
Key Announcements:
- Seven high-speed rail corridors announced (Mumbai-Pune, Pune-Hyderabad, Bengaluru-Chennai, and others)
- ₹3,000 crore for National Industrial Corridor Development
- ₹10,000 crore for container manufacturing ecosystem
- Increased allocations for river basin management and Jal Jeevan Mission
Stocks to Watch:
- Larsen & Toubro (L&T)
- Rail Vikas Nigam Limited (RVNL)
- IRCON International
- Container Corporation of India
- Shipping Corporation of India
Trading Strategy: Long-term accumulation on dips. Infrastructure stocks typically take 6-12 months to reflect budget allocations in earnings, making them ideal for positional trades.
2. Healthcare & Medical Tourism (Very Strong)
Why They’ll Rally: The government announced five new medical tourism hubs and allocated $1.1 billion over five years for biologics and biosimilar drug production.
Market Reaction: Hospital stocks rallied immediately post-budget, with some gaining up to 4-7% on Budget Day itself.
Stocks to Watch:
- Apollo Hospitals
- Max Healthcare
- Fortis Healthcare
- Metropolis Healthcare
Trading Strategy: These stocks showed resilience even during the broader market selloff. Short to medium-term buying opportunities on corrections.
3. Manufacturing & Electronics (Government Priority)
Why They’ll Rally: Manufacturing is at the heart of Budget 2026, with the government committed to boosting domestic production capacity.
Key Allocations:
- ₹40,000 crore for electronics components manufacturing (doubled from previous year)
- ₹1,000 crore for India Semiconductor Mission 2.0
- ₹1,500 crore for Electronics Components Manufacturing Scheme
- PLI Scheme for White Goods increased to ₹1,004 crore from ₹304 crore
Special Focus: The budget also announced rare earth corridors in Odisha, Kerala, Andhra Pradesh, and Tamil Nadu to reduce import dependence.
Stocks to Watch:
- Dixon Technologies
- Amber Enterprises
- Kaynes Technology
- Electronics companies in the component ecosystem
Trading Strategy: Staggered buying over 3-6 months as PLI benefits typically take time to materialize in earnings.
4. Textiles & Leather (Export Focus)
Why They’ll Rally: Budget 2026 introduced a dedicated Textile Export Incentive Scheme with enhanced global competitiveness measures and lower import duties on specialized raw materials.
Key Support:
- Mega textile parks announced
- Support for highly labour-intensive textile and leather sectors
- Mahatma Gandhi Gram Swaraj Yojana for Khadi handloom sector
Stocks to Watch:
- Raymond
- Welspun India
- Arvind Limited
- Page Industries
Trading Strategy: Watch for implementation details in coming weeks. Entry points may emerge on sector rotation.
5. Data Centers & Cloud Services (Game Changer)
Why They’ll Rally: Tax holiday until 2047 for foreign companies providing cloud services globally using data center infrastructure in India.
Why This Matters: Data centers are large, predictable consumers of power with long investment horizons. This positions India as a global hub for digital infrastructure.
Stocks to Watch:
- Anant Raj Ltd (witnessed notable gains on Budget Day)
- Yotta Infrastructure
- CtrlS Datacenters
- Companies in the AI and cloud investment space
Trading Strategy: Long-term thematic investment. This is a 20+ year vision that will create sustained demand.
6. Defence (Steady Growth)
Why They’ll Rally: Defence outlay increased by 15% for FY27, though some market participants expected higher allocations.
Key Developments:
- Continued focus on Atmanirbharta (self-reliance)
- Support for domestic manufacturing capacity
Stocks to Watch:
- Bharat Electronics (BEL) – Despite initial decline, long-term fundamentals remain strong
- Hindustan Aeronautics Limited (HAL)
- Solar Industries
Trading Strategy: Buy on significant dips. Defence is a long-term structural story.
7. Green Energy & Clean Technology
Why They’ll Rally: Basic customs duty exemption on lithium-ion cells to enhance cost competitiveness of battery storage manufacturing.
Additional Support:
- Duty exemption on capital goods for nuclear power plants until 2035
- Focus on carbon capture, utilization, and storage in industrial sectors
- Emphasis on rare earth development for climate objectives
Stocks to Watch:
- Tata Power
- NTPC Green Energy
- Adani Green Energy
- Battery and EV component manufacturers
Trading Strategy: Green energy is a multi-year theme. Use market weakness for accumulation.
Losers: Sectors Under Pressure
1. Brokerages & Stock Exchanges (Significant Negative)
Why They’re Under Pressure: The STT hike directly impacts their business model.
Market Reaction:
- Angel One Ltd fell sharply
- BSE crashed 10% on Budget Day
- Zerodha and other discount brokers face margin pressure
Impact Analysis: Given that derivatives account for a significant portion of brokerage revenues, near-term earnings growth is likely subdued unless offsetting measures boost participation.
Trading Strategy: Avoid or trade only with strict stop-losses. Wait for business model adjustments.
2. PSU Banks (Short-term Negative)
Why They’re Under Pressure: The Nifty PSU Bank index slumped nearly 6% on Budget Day.
Reason: Higher borrowing program (₹17.2 lakh crore to plug fiscal deficit) and lack of immediate positive triggers.
Stocks Affected:
- Bank of India (down 6.95%)
- Bank of Baroda
- Union Bank
- State Bank of India (down 5.43%)
Trading Strategy: This may be an overreaction. PSU banks are trading at attractive valuations. Watch for reversal signals.
3. FMCG & Sin Stocks (Margin Pressure)
Why They’re Under Pressure:
- Increased excise duties on tobacco
- Doubled TCS rate on alcoholic liquor
- Absence of major personal tax relief limiting FMCG demand
Stock Affected:
- ITC Ltd (fell 4.31% on Budget Day due to tobacco duties)
- United Spirits
- Other cigarette and alcohol companies
Trading Strategy: Sector may remain under pressure. These are quality companies, but wait for better entry points.
4. Metals (Mixed Outlook)
Why They Faced Selling: Nifty Metal index dropped 4% on Budget Day.
However, Long-term Positives:
- Seven high-speed rail corridors will boost steel demand
- Rare earth corridor allocations benefit mining companies
- Train coach production to increase
Stocks to Monitor:
- Hindalco (down 6% on Budget Day but fundamentals improving)
- Tata Steel
- JSW Steel
Trading Strategy: This sector saw panic selling. Selective buying on further weakness could work for medium-term.
Special Mentions: Sector-Specific Opportunities
IT Services (Safe Harbor Changes)
The budget announced major changes in safe harbour margin regime, which benefited IT stocks. Nifty IT was the only index to close in green on Budget Day.
Stocks:
- TCS (up ~2%)
- Wipro (up ~2%)
- Infosys
Strategy: Defensive play with steady growth. Good for risk-averse traders.
FMCG Logistics
₹10,000 crore allocated for container manufacturing strengthens the logistics ecosystem and supports exports.
Stocks:
- Blue Dart
- VRL Logistics
- Transport Corporation of India
Strategy: Secondary beneficiaries of infrastructure push. Monitor for momentum.
Tourism & Hospitality
National Institute of Hospitality announced, pilot scheme for tourist guides, special focus on Uttarakhand to Eastern Ghats tourism.
Stocks:
- Indian Hotels (Taj)
- Lemon Tree Hotels
- EIH Limited
Strategy: Longer gestation period but structural tailwinds building.
City Economic Regions: A New Growth Catalyst
The budget proposed City Economic Regions (CERs) with ₹5,000 crore per city over five years. Focus on Tier-2 and Tier-3 cities ensures growth is not limited to metros.
Beneficiaries:
- Real estate developers in Tier-2/3 cities
- Regional banks
- Infrastructure companies with exposure to these regions
Trading Strategies for Different Time Horizons
For Day Traders (1-5 Days)
- Avoid: Highly volatile stocks like brokerages and PSU banks until trend clarity
- Focus on: IT stocks (defensive), selective pharma plays
- Watch: Intraday support at Nifty 24,650-24,700; resistance at 25,200
For Swing Traders (1-4 Weeks)
- Buy dips in: Healthcare, IT services, select infrastructure
- Short on rallies: Overvalued FMCG names, weak financials
- Key levels: Nifty 24,500 (strong support), 25,800 (key resistance)
For Positional Traders (1-6 Months)
- Accumulate: Infrastructure, manufacturing, green energy on 5-10% corrections
- Build positions: Defence stocks if they correct 15-20%
- Avoid fresh buying: Brokerages until business model clarity
For Long-term Investors (1+ Years)
- Core holdings: L&T, Apollo Hospitals, TCS, select PSU banks at current valuations
- Thematic bets: Data centers, clean energy, semiconductors
- SIP/DCA approach: Use market weakness in quality names
Risk Factors to Monitor
1. Global Uncertainties
The budget was presented amid acute geopolitical uncertainty and US tariff wars (50% tariffs on Russian oil imports). Global developments will continue to drive sentiment.
2. Execution Risk
Large allocations don’t automatically translate to completed projects. State-led investment cannot indefinitely substitute for private capital.
3. Private Capex
The real test lies in whether private sector capex can accelerate to complement government spending.
4. Foreign Flows
The lack of strong measures to revive foreign institutional investment weighed on near-term liquidity expectations.
Technical Outlook Post-Budget
Nifty 50 Analysis:
- Budget Day saw an intraday swing of 869 points (widest since June 4, 2024)
- Formed bearish candle with long lower shadow
- Immediate support: 24,650-24,700
- Key resistance: 25,200-25,400
Market Breadth:
- Nearly 2 stocks declined for every advancing share on Budget Day
- 2,073 NSE stocks ended in red vs 1,057 gainers
- Broader indices (midcap, smallcap) fell 2-3%
Expert Views
Market analysts believe the Budget is “slightly disappointing from a stock market perspective” primarily due to the STT hike and absence of capital gains tax relief that many participants expected.
However, the structural measures-elevated infrastructure spending, targeted industry stimulus, and focus on manufacturing – could support sustained recovery once financial certainty feeds into corporate earnings growth.
Key Takeaways for Traders
- Short-term pain, long-term gain: The market selloff was a knee-jerk reaction. Long-term fundamentals remain intact.
- Sector rotation likely: Money will flow from overvalued defensive sectors to beaten-down cyclicals as infrastructure spending kicks in.
- Quality over quantity: In a higher transaction cost environment (due to STT), focus on quality trades with higher conviction.
- Earnings season matters: The ongoing earnings season, along with monetary policy and global developments, will drive markets in the near term.
- Budget benefits have lag: Infrastructure, manufacturing, and policy-driven benefits typically take 6-12 months to reflect in corporate earnings.
Action Plan for Traders
Immediate (Next 2 Weeks):
- Book profits in overbought defensive stocks
- Build watchlists in infrastructure, healthcare, manufacturing
- Reduce leverage and speculative positions (STT impact)
Short-term (1-3 Months):
- Start accumulating quality beaten-down stocks
- Focus on stocks with direct budget beneficiaries
- Monitor Q4 FY26 earnings for implementation signals
Medium-term (3-6 Months):
- Build positions in infrastructure, manufacturing, green energy
- Diversify across budget themes (not just one sector)
- Review and rebalance as earnings clarity emerges
Long-term (6+ Months):
- Hold quality infrastructure and manufacturing plays
- Average up in winners, cut losers ruthlessly
- Stay invested in India’s structural growth story
Conclusion: Navigating the Post-Budget Landscape
Budget 2026 is a pragmatic blueprint that balances ambition with fiscal prudence. While the STT hike disappointed short-term traders, the government’s commitment to infrastructure-led growth, manufacturing push, and sector-specific incentives creates a strong foundation for medium to long-term wealth creation.
For traders at Vaishvik Traders in Jaipur and across India, the key is to look beyond the immediate noise. The budget has clear winners in infrastructure, healthcare, manufacturing, and clean energy. The market will eventually reward those who position themselves correctly in these themes.
Remember: successful trading isn’t about predicting every twist and turn – it’s about understanding the bigger picture and positioning your portfolio to benefit from structural trends. Budget 2026 has laid out the roadmap. The question is: are you ready to trade it?
Disclaimer: This article is for educational purposes only and should not be considered as investment advice. Always conduct your own research and consult with a SEBI-registered investment advisor before making investment decisions. Past performance is not indicative of future results.
About Vaishvik Traders: A leading stock market training institute in Jaipur, offering comprehensive courses in stock trading, forex trading, and commodity trading. Learn more about building wealth through disciplined trading strategies.
The stock market is no longer just about gut feelings and manual chart analysis. In 2026, artificial intelligence has become the secret weapon that levels the playing field between institutional traders and retail investors. Whether you’re a beginner trader or an experienced investor looking to sharpen your edge, AI tools can help you make faster, smarter, and more data-driven trading decisions.
But here’s the reality: AI won’t make you rich overnight. What it will do is give you access to the same kind of market intelligence that was once reserved for hedge funds and professional traders. From analyzing news sentiment to detecting chart patterns in milliseconds, AI is transforming how we trade – and it’s more accessible than ever before.
In this comprehensive guide, we’ll explore exactly how beginners can leverage AI tools for stock trading, which platforms are worth your attention, and how Vaishvik Traders is preparing students for this AI-powered future.
Understanding AI in Stock Trading: The Basics
AI trading refers to the use of artificial intelligence and machine learning algorithms to analyze market data, identify patterns, predict price movements, and even execute trades automatically. Think of it as having a tireless research assistant that can process millions of data points in seconds – something no human trader could ever do manually.
AI trading systems work by:
- Data Analysis: Processing vast amounts of historical price data, trading volumes, news articles, social media sentiment, and economic indicators.
- Pattern Recognition: Identifying trends and patterns that human traders might miss due to cognitive biases or information overload.
- Predictive Analytics: Using machine learning models to forecast potential price movements based on historical patterns and current market conditions.
- Risk Management: Calculating optimal position sizes, stop-loss levels, and portfolio allocation based on your risk tolerance.
- Automation: Executing trades automatically based on predefined rules and real-time market analysis.
Why AI Matters for Beginners in 2026
The Indian stock market has become increasingly competitive with millions of new retail traders entering every year. AI tools give beginners several critical advantages:
- Reduced Emotional Trading: AI makes decisions based on data, not fear or greed. It won’t panic-sell during a dip or chase momentum trades out of FOMO.
- 24/7 Market Monitoring: While you sleep, AI tools can track global markets, breaking news, and overnight developments that might affect your Indian stocks.
- Learning Acceleration: AI tools help you understand market mechanics faster by showing you patterns, explaining company fundamentals, and breaking down complex financial data into simple insights.
- Time Efficiency: Instead of spending hours analyzing charts and reading annual reports, AI can do the heavy lifting and present you with actionable insights.
- Access to Institutional-Grade Analysis: Tools that were once available only to large investment firms are now accessible to retail traders in India through affordable or even free platforms.
Types of AI Tools Every Beginner Should Know
Let’s break down the main categories of AI tools available to traders in 2026:
1. AI-Powered Research and Analysis Tools
These tools help you understand stocks better by analyzing company fundamentals, news, and earnings reports.
ChatGPT and Similar Language Models
General-purpose AI chatbots like ChatGPT have become surprisingly useful for stock market research. Recent studies show that ChatGPT-4 can analyze financial information and predict stock movements with reasonable accuracy. A 2023 research study found that ChatGPT’s attractiveness ratings for stocks correlated positively with future stock returns.
How beginners can use it:
- Ask questions about company fundamentals in simple language
- Get explanations of financial ratios (P/E, ROE, debt-to-equity) without jargon
- Understand complex earnings reports broken down into plain English
- Compare multiple stocks side-by-side
- Learn trading concepts and strategies
Limitations: ChatGPT doesn’t have real-time market data and shouldn’t be used for live trading decisions. It’s best for education and understanding concepts.
Indian-Specific AI Research Tools
Several platforms have emerged specifically for the Indian market:
Stoxo AI by StockGro: Offers AI-powered signals and insights for Indian stocks, providing live trade signals, sector-level analysis, and pattern identification based on NSE and BSE data.
Portal AI (TradeBrains): Enables filtering stocks based on fundamental analysis (P/E ratio, debt-equity, revenue growth) with AI-driven insights for value analysis and peer comparisons.
StockInsights.ai: Provides AI summaries of company results, earnings reports, and valuations with simplified insight cards showing whether stocks are overvalued or undervalued.
IMATE by Insights.Market: A SEBI-registered platform offering both technical and fundamental analysis specifically for Indian stocks, with real-time data analysis suitable for intraday decisions.
2. AI Trading Bots and Automated Platforms
These platforms don’t just analyze – they can execute trades based on AI-driven strategies.
Trade Ideas (Holly AI)
One of the most established AI trading platforms since 2003, Trade Ideas features its Holly AI system that generates trading signals and adapts strategies daily based on market conditions. It automatically identifies patterns, backtests strategies, and can integrate with brokers for automated execution.
Who it’s for: Intermediate to advanced traders who want comprehensive AI-powered analysis. It has a steep learning curve but offers institutional-grade capabilities.
Pricing: Premium plans start around $1,000/year with real-time data and advanced features.
TrendSpider
A comprehensive AI-driven platform that automates technical analysis. TrendSpider’s algorithms automatically identify and draw trendlines, detect over 150 candlestick patterns, and recognize dozens of classic chart patterns.
Key features:
- Automated pattern recognition
- Multi-timeframe analysis
- Strategy backtesting
- Real-time alerts
Who it’s for: Traders focused on technical analysis who want to save hours of chart work.
3Commas and Bitsgap (Primarily Crypto but Applicable)
While these platforms are known for cryptocurrency trading, many concepts apply to stock trading as well. They offer:
- Grid trading automation
- Copy trading (following successful traders)
- Portfolio management with AI optimization
3. AI Sentiment Analysis Tools
These tools scan news, social media, and financial reports to gauge market sentiment.
TradeEasy.ai
A free platform that aggregates financial articles in real-time from reputable sources and performs:
- Sentiment Analysis: Assigns Bullish, Neutral, or Bearish labels
- Impact Analysis: Estimates whether news is Low, Medium, or High impact
- AI Assistant: Provides conversational interface for asking financial questions
Who it’s for: News-driven traders and beginners who want to understand what’s moving the market.
StockGeist
Uses advanced AI to process social media mentions for 2,200+ companies, providing:
- Real-time sentiment indicators
- Message volume tracking
- Word frequency analysis showing what topics dominate discussions
- Timeline of major news events
Tickeron
Offers AI-powered pattern recognition and confidence ratings for predictions across stocks, ETFs, forex, and crypto. It democratizes institutional-grade forecasting for retail investors.
Features:
- AI-generated trade signals
- Pattern search engine
- Confidence ratings on predictions
- Educational resources
Pricing: Affordable at around $60/year, making it accessible for beginners.
4. AI-Powered Charting and Technical Analysis
TradingView with AI Indicators
TradingView has integrated AI-powered indicators in 2025-2026 that can:
- Automatically detect chart patterns (head & shoulders, wedges, flags)
- Highlight breakout zones
- Identify potential trend reversals
- Enable script automation for backtesting
Coverage: Supports NSE and BSE data with a strong Indian trading community.
Pricing: Robust free plan available, making it perfect for beginners.
5. AI-Based Portfolio Management
RockFlow
Designed as an AI trading app for beginners with:
- TradeGPT assistant (like a trading coach that answers questions and explains trends)
- Custom advice based on your trading style
- Educational guides and lessons
- Auto-trading capabilities
Why it’s great for Gen Z traders: Fast, mobile-first design with real-time data checks and strategy recommendations.
Smallcase (India-Specific)
While not purely an AI tool, Smallcase offers curated portfolios (smallcases) based on AI-driven logic covering various strategies, sectors, and themes. Perfect for long-term investors who want ready-made stock baskets.
Free vs. Paid AI Tools: What Should Beginners Choose?
Free Tools Worth Using
1. ChatGPT (Free Tier)
- Best for: Learning, understanding concepts, company research
- Limitation: No real-time data
2. TradingView (Free Plan)
- Best for: Chart analysis, pattern recognition
- Limitation: Delayed data, limited indicators
3. TradeEasy.ai
- Best for: News sentiment analysis
- Limitation: No direct trading signals
4. Tickertape by Smallcase (Free Access)
- Best for: Stock screening, mutual fund analysis
- Limitation: Limited advanced filters
5. Screener.in
- Best for: Fundamental analysis of Indian stocks
- Limitation: Manual analysis required
When to Consider Paid Tools
Upgrade to paid tools when:
- You’re actively trading (not just learning)
- You need real-time data and alerts
- You want advanced backtesting capabilities
- You’re serious about automation
- Free tools no longer meet your analysis depth
Realistic Budget for Beginners:
- ₹5,000-₹10,000/year for quality AI tools
- Start with free tools, then upgrade one tool at a time
- Vaishvik Traders students get guidance on cost-effective tool combinations
How to Actually Use AI Tools: A Beginner’s Workflow
Let’s walk through a practical example of how a beginner might use AI tools for a stock trading decision:
Step 1: Market Overview (Morning Routine – 15 minutes)
9:00 AM – Before Market Opens
Tool: TradeEasy.ai or StockGeist
- Check sentiment on major indices (Nifty, Bank Nifty, Sensex)
- Identify which sectors are getting positive/negative news
- Look for high-impact news events
Example: You see that renewable energy stocks are getting bullish sentiment due to new government policy announcements.
Step 2: Stock Research (30 minutes)
Tool: ChatGPT + Portal AI
Ask ChatGPT: “Explain the renewable energy sector in India. Which are the major companies and what fundamentals should I look at?”
Use Portal AI to filter:
- Renewable energy stocks
- P/E ratio < 30 (not overvalued)
- Debt-to-equity < 1 (financially healthy)
- Revenue growth > 15% YoY
Result: You get a shortlist of 5-7 stocks worth investigating.
Step 3: Technical Analysis (20 minutes)
Tool: TradingView with AI Indicators
For each shortlisted stock:
- Check AI-detected patterns
- Look for breakout signals
- Identify support/resistance levels
- Check volume trends
Example: AI shows a “bullish flag pattern” forming on Adani Green Energy with increasing volume.
Step 4: Deep Dive (20 minutes)
Tool: StockInsights.ai
Read the AI-generated summary of the latest:
- Quarterly results
- Management commentary
- Analyst recommendations
- Key risks
Step 5: Risk Assessment
Tool: Personal calculation + AI suggestion
Before placing any trade:
- Determine position size (never risk more than 1-2% of capital)
- Set stop-loss level (AI tools like TrendSpider can suggest optimal levels)
- Define profit target
- Calculate risk-reward ratio (aim for minimum 1:2)
Example Decision:
- Entry: ₹950
- Stop-loss: ₹920 (3.16% risk)
- Target: ₹1,010 (6.32% profit)
- Risk-Reward: 1:2 ✓
Step 6: Execution & Monitoring
Tool: Broker platform + Alert system
- Place the trade through your broker
- Set price alerts on TradingView
- Monitor news sentiment through TradeEasy.ai
Step 7: Post-Trade Analysis
Tool: Trading journal (manual) + AI analysis
After the trade closes:
- Record the trade details
- Ask ChatGPT: “I bought [stock] at [price] based on [pattern]. It moved to [exit]. What could I have done better?”
- Use AI to identify pattern success rates
Common Mistakes Beginners Make with AI Tools
1. Over-Reliance on AI
The Mistake: Treating AI recommendations as guaranteed profits without understanding the underlying logic.
The Reality: Even the best AI tools have limitations. The Alpha Arena experiment in late 2025 showed that while Chinese AI models like DeepSeek achieved 126% returns, Western models like GPT-5 suffered 60% losses—all using the same data. This proves AI isn’t foolproof.
The Fix: Always understand WHY the AI is making a recommendation. Use AI as a tool to enhance your analysis, not replace your judgment.
2. Ignoring Risk Management
The Mistake: Following AI signals without proper position sizing or stop-losses.
The Reality: AI can tell you WHAT to buy, but only you can decide HOW MUCH to risk based on your personal financial situation.
The Fix: Learn risk management principles at Vaishvik Traders before automating any trades.
3. Using Multiple Conflicting Tools
The Mistake: Checking 10 different AI tools that give contradictory signals, leading to analysis paralysis.
The Reality: More tools don’t equal better decisions. It creates confusion.
The Fix: Pick 2-3 complementary tools (one for fundamentals, one for technicals, one for sentiment) and master them.
4. Neglecting to Backtest
The Mistake: Implementing an AI strategy with real money without testing it on historical data.
The Reality: What works in theory may fail in practice.
The Fix: Use platforms like Trade Ideas or TrendSpider to backtest strategies for at least 6-12 months of historical data before going live.
5. Ignoring Black Swan Events
The Mistake: Assuming AI will predict unpredictable events (regulatory changes, geopolitical crises, pandemic-type shocks).
The Reality: AI excels at pattern recognition but fails with unprecedented events.
The Fix: Always maintain portfolio diversification and never invest money you can’t afford to lose.
6. Chasing Free Tools Without Learning Fundamentals
The Mistake: Jumping from one free AI tool to another hoping to find the “magic formula.”
The Reality: Tools are useless without understanding market fundamentals.
The Fix: Get proper training at institutes like Vaishvik Traders that combine AI tool education with foundational market knowledge.
Conclusion: AI is a Tool, Not a Magic Wand
The revolution in AI-powered stock trading is real, and it’s happening right now in 2026. From sentiment analysis to pattern recognition, from portfolio optimization to automated execution – AI tools are democratizing access to sophisticated trading intelligence.
But here’s the truth that responsible educators like Vaishvik Traders want you to understand: AI is not a shortcut to riches. It’s a powerful tool that amplifies your knowledge and accelerates your analysis – but only if you first build a solid foundation.
Beginners have unprecedented advantages:
- Access to world-class AI tools at low or zero cost
- Growing Indian platforms designed specifically for NSE/BSE trading
- Local training institutes incorporating AI into comprehensive curriculum
- A supportive community of traders exploring these tools together
The winners in this AI-powered market won’t be those who use the most tools or follow the fanciest algorithms. They’ll be the traders who:
- Understand market fundamentals before relying on AI
- Manage risk religiously no matter what AI suggests
- Stay disciplined and don’t chase every signal
- Keep learning as the AI landscape evolves
- Use AI to enhance, not replace, human judgment
At Vaishvik Traders, stock market institute in Jaipur, we’re committed to preparing the next generation of smart traders who leverage technology without becoming dependent on it. Whether you’re exploring AI tools on your own or considering formal training, remember: the goal isn’t to let AI trade for you – it’s to become a better trader with AI by your side.
The future of trading is intelligent, data-driven, and accessible. The question is: are you ready to be part of it?
Tools like Google Trends show how search behavior shifts over time and what financial topics are gaining traction. When analyzed with a local lens, this data tells us not only what investors worldwide are thinking, but what traders in Jaipur specifically are curious about — whether they’re learning stock trading, exploring forex, or considering opportunities in the markets alongside their daily life in Rajasthan.
Here’s what Google Trends and related insights reveal about the questions and interests emerging from Jaipur, and what they indicate about trader behavior.
Why Google Trends Matters to Jaipur Traders
Google Trends doesn’t provide exact numbers of searches, but it shows the relative interest over time for specific trading questions and terms. In places like Jaipur, where retail trading interest is growing, this data reflects what real people want to understand — from basics like “how to begin trading” to more advanced topics like “market sentiment”.
Unlike YouTube comments or Telegram chatter, search queries are private and often honest. When Jaipur residents type something into Google, they reveal their true curiosity — and this makes Trends data a powerful reflection of learner sentiment and confusion points.
Trend 1: “How to Start Trading” and Beginner Queries
A consistent trend across India — including in cities like Jaipur — is high search interest in:
- How to start stock trading
- How to begin forex trading
- Trading for beginners
This pattern shows that new traders are entering the market constantly. Despite the flood of YouTube videos, videos, and social content, many beginners still feel lost when deciding where to begin. The reason is simple: most free content jumps straight into strategies or indicators without teaching foundational concepts first — such as risk management, market behaviour, and trading psychology.
This search behaviour reflects a real gap: learners want structured direction rather than random tips. Beginners in Jaipur aren’t just looking for quick wins — they’re searching for how to properly start trading with clarity and confidence. If you are onto the similar question, then come visit Vaishvik Traders, the best stock market institute in Jaipur that helps student learn using live market exposure.
Trend 2: Spikes in “Best Indicator” Searches During Volatility
Another clear pattern on Google Trends is periodic spikes in searches like:
- Best indicator for stock trading
- Best indicator for forex trading
These surges often happen during volatile market periods or after strong price moves (e.g., when Sensex or Nifty show large swings) — and can be observed alongside broader market trend shifts seen in Indian markets.
In Jaipur, traders tend to search these when markets are either sharply rising or correcting, showing a behavioral pattern of urgency. When price moves quickly, retail traders often want a tool that appears objective and mathematical. They hope an “indicator” will simplify decision-making.
But Google Trends shows that this search pattern emerges after volatility has already increased — indicating a behaviour that often leads traders to buy after the signal has come.
This reflects a common psychology:
- People search for tools in moments of uncertainty
- Emotional urgency drives those searches
- Indicators without context can mislead
Trend 3: Searches about Losses and Why Trading Isn’t Easy
Search trends also show periodic interest in:
- Why am I losing money in trading
- Most common trading mistakes
- Why traders fail
This trend is significant because it suggests that traders in Jaipur and across India are not just looking for profits — they are trying to understand losses and mistakes. Many of these searches increase after choppy market phases or when sudden corrections happen.
Instead of hunting signals for entry, these queries indicate a deeper concern — traders are asking why their approach isn’t working.
This reflects something very real: financial markets are a mental and risk management challenge, not just a pattern-matching exercise. When traders realize this, they often move from instinct-based decisions to education-driven skill building.
Trend 4: “Is Trading Gambling?” Pops Up Among Search Queries
Among the more interesting recurring search themes is:
- Is stock trading gambling?
- Is forex trading gambling?
These questions often spike around periods of confusion or when markets suddenly move against trend expectations. The fact that such searches repeatedly appear suggests that many Jaipur traders — especially beginners — feel unsure whether they’re investing intelligently or merely guessing.
This uncertainty is common in markets because inconsistent results and emotional decisions make trading feel gambling-like, even when an underlying method is being applied. Google Trends highlights this sentiment, showing that many traders question whether skill or luck drives market success.
Trend 5: Growing Interest in Trading Psychology and Discipline
In recent times, search interest for terms like:
- Trading psychology
- Emotional trading
- Fear and greed in trading
has been gradually increasing. This is a positive and advanced trend, because it indicates that traders are moving past simple buy/sell mechanics and starting to explore why they behave the way they do in markets.
Traders begin to study psychology when they’ve tried strategies, seen inconsistent results, and realized that emotions shape outcomes. The fact that these topics show traction on Trends suggests that Jaipur traders, like many others, are gradually understanding that the mental game matters as much as chart setups.
Trend 6: Forex Curiosity During Global Economic News
Search interest for forex-related terms tends to spike during:
- Major macroeconomic announcements
- Interest rate decisions
- Global financial events
This is a universal pattern, but in India it becomes more visible around key RBI policy moves, inflation reports, and global cues like US rate updates. Rising interest in forex during such times suggests that traders in Jaipur are viewing currency markets not as separate from equities but as part of the overall macroeconomic landscape.
What These Jaipur-Focused Trends Really Mean
When we bring Google Trends data into the local context of Jaipur — a city with a growing finance and entrepreneurial culture — a few insights stand out:
1. Beginners dominate search trends:
High volume of “how to start trading” searches means new traders are entering continuously and need structured foundational knowledge.
2. Indicator curiosity spikes with volatility:
Search interest in “best indicator” is usually reactive, not proactive — often coming after the market is already moving.
3. Loss and failure searches reflect real trader pain:
When traders realize mistakes hurt equity, they ask deeper questions that hint at psychology and process problems, not just signal failures.
4. Psychology and behavior matter:
Searches for emotional and mental aspects of trading confirm that many people in Jaipur and India are seeking more than technical setups — they are searching for understanding.
5. Forex interest peaks with macro shifts:
Jaipur traders, like others, link currency markets with global events, macroeconomic news, and risk — not just retail speculation.
Using Google Trends to Become a Smarter Trader
Rather than chasing trending signals, trend data can be used as:
- A sentiment indicator: High search interest on a topic often coincides with crowded behavior.
- A risk awareness tool: Traders can avoid emotional crowd moves that often happen after peaks in search interest.
- A learning signal: Persistent search terms (like psychology or mistakes) highlight areas where structured education will help most.
This is why so many Jaipur traders begin seeking structured stock market education, learning foundational topics like risk management, price action, and disciplined execution rather than relying solely on reactive choices.
Final Thoughts: Trends Reflect Curiosity, Not Guarantees
Google Trends does not predict markets, but it does reveal real trader intentions and pain points — especially in regions like Jaipur where search behavior reflects both curiosity and confusion.
If you find your own questions echoed in these trends, it’s a cue to focus on framework over fads — to evolve from impulse-based searching to process-based learning.
And for traders in Jaipur, that journey often begins with committed learning, continuous practice, and structured understanding — not just watching search interests rise and fall.
Technical indicators are among the most widely discussed tools in stock trading, yet they are also among the most misunderstood. For many traders, indicators become mechanical objects placed on charts with the expectation that they will generate clear buy and sell signals. Lines cross, oscillators hit certain levels, alerts trigger—and trades are executed without a true understanding of what the indicator is actually measuring.
This approach almost always leads to frustration.
In reality, technical indicators do not generate signals on their own. They are mathematical interpretations of price, volume, and volatility, designed to organize information that already exists in the market. When used correctly, indicators help traders reduce emotional bias, improve consistency, and build structured decision-making processes. When used incorrectly, they create dependency, confusion, and overtrading.
This guide explains technical indicators in depth—how they are built, what they measure, when they work, when they fail, and how professional traders integrate them into a structured trading process. The goal is not to promote indicators as shortcuts, but to explain them as analytical tools that support disciplined trading.
Understanding the Core Purpose of Technical Indicators
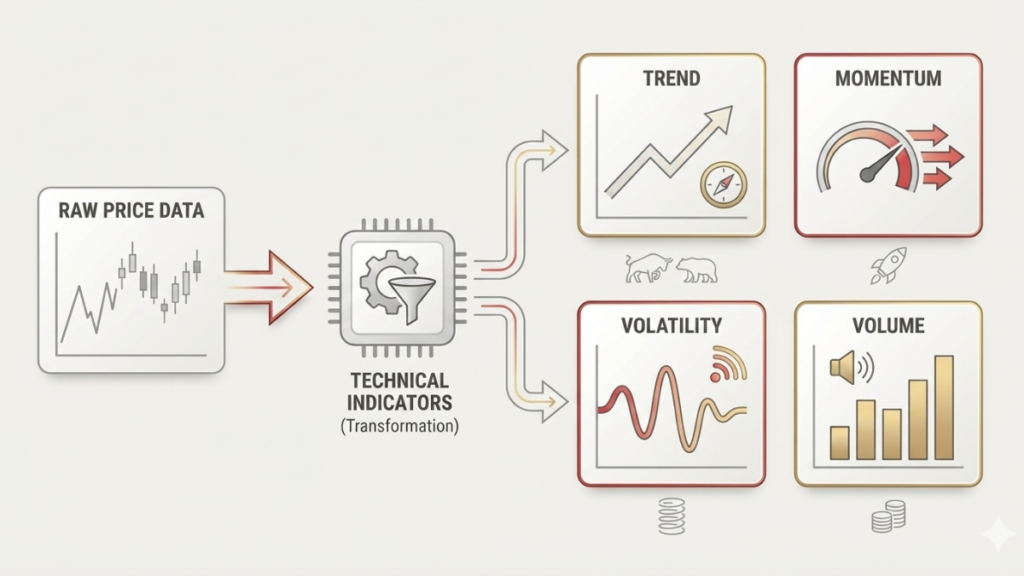
Before discussing individual indicators, it is critical to understand why indicators exist in the first place.
Price data alone can be noisy, emotionally misleading, and difficult to quantify consistently. A raw price chart reflects constant fluctuations caused by short-term order flow, news reactions, and trader psychology. While experienced traders can read price action directly, most traders need tools that help them organize and filter information.
Technical indicators compress market information into interpretable metrics. They transform raw price and volume data into forms that highlight specific characteristics of market behavior. Importantly, they do not predict the future. Instead, they describe the current state of the market more clearly.
Indicators help traders answer practical questions such as whether the market is trending or ranging, whether momentum is strengthening or weakening, whether volatility is expanding or contracting, and whether participation is increasing or decreasing. Each indicator exists to answer one specific question. Expecting an indicator to do more than that is the root cause of misuse.
The Mathematical Nature of Indicators and Why They Lag
All technical indicators are derived from historical data. This includes past prices, past volume, and past volatility. Because indicators are calculated using completed candles or bars, they are inherently reactive. This means every indicator lags price to some extent.
Even indicators often described as “leading” still rely on historical inputs. The difference between leading and lagging indicators is not whether they use past data, but how they process that data. Leading indicators react faster but are more sensitive to noise, while lagging indicators react slower but provide greater stability.
Professional traders accept lag as a trade-off for reduced noise, improved clarity, and higher probability decisions. The objective is not to eliminate lag, but to use it intelligently. Lag helps confirm behavior rather than anticipate it prematurely.
Classification of Technical Indicators
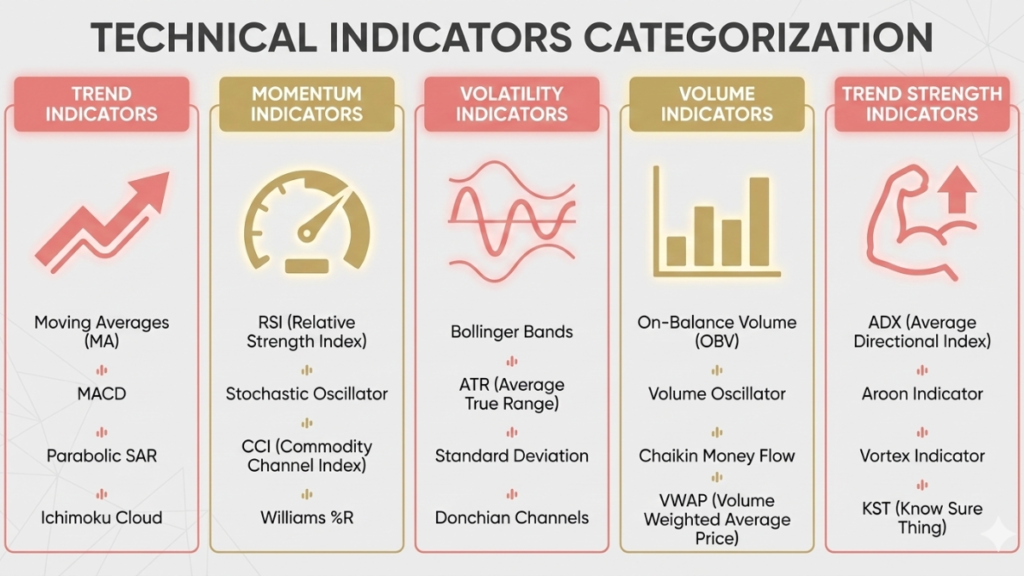
Technical indicators fall into five primary categories, each serving a different analytical function. Understanding these categories helps traders select the right tool for the right purpose.
The five major categories are trend indicators, momentum indicators, volatility indicators, volume indicators, and trend strength indicators. No single category is sufficient on its own. Effective analysis comes from combining insights across categories.
Trend Indicators and Market Direction
Trend indicators help determine whether price is moving with directional intent or not. A trend represents sustained imbalance between buyers and sellers. Most professional traders prefer to trade in the direction of the trend because trends reflect institutional participation rather than random retail activity.
Moving Averages (MA): Deep Explanation
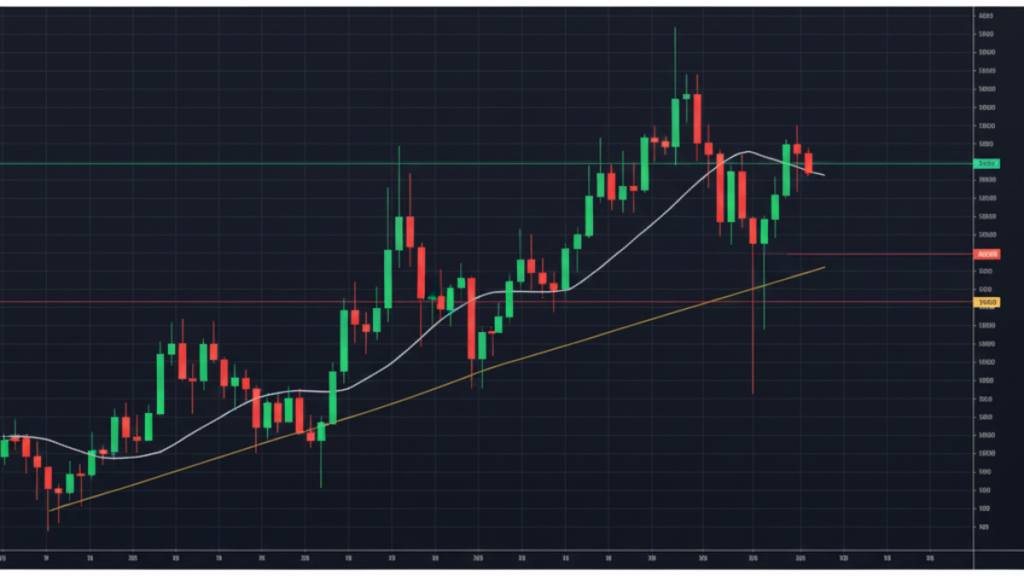
Moving averages are the most widely used trend indicators. A moving average calculates the average price over a fixed lookback period, smoothing short-term fluctuations to reveal underlying direction.
A Simple Moving Average (SMA) assigns equal weight to all data points in the lookback period. Because it reacts slowly to price changes, it is commonly used for identifying long-term trends and major market structure.
An Exponential Moving Average (EMA) assigns greater weight to recent prices. This makes it more responsive to current market conditions and better suited for short-term, swing, and intraday trading.
Commonly used periods include the 20 EMA for short-term trends, the 50 EMA for medium-term trends, and the 200 EMA for long-term trends. These levels are widely observed by market participants, which increases their relevance.
How Moving Averages Represent Market Behavior
Moving averages represent more than just averages. They reflect consensus price over time, dynamic equilibrium between buyers and sellers, and areas where institutional orders are often concentrated. When price repeatedly respects a moving average, it suggests organized participation rather than random movement.
Dynamic Support and Resistance
In trending markets, moving averages often function as dynamic support and resistance zones. In an uptrend, price tends to pull back toward an EMA before continuing higher. In a downtrend, price often rallies toward an EMA before resuming lower.
Professionals observe how price behaves around the moving average. Strong rejection suggests trend continuation, while acceptance or prolonged consolidation may indicate weakening momentum.
Moving Average Slope and Trend Quality
The slope of a moving average is often more important than its position. A steep slope indicates strong directional commitment, while a flat slope suggests consolidation or transition. Changes in slope often precede changes in market behavior.
Moving Average Crossovers from a Professional Perspective
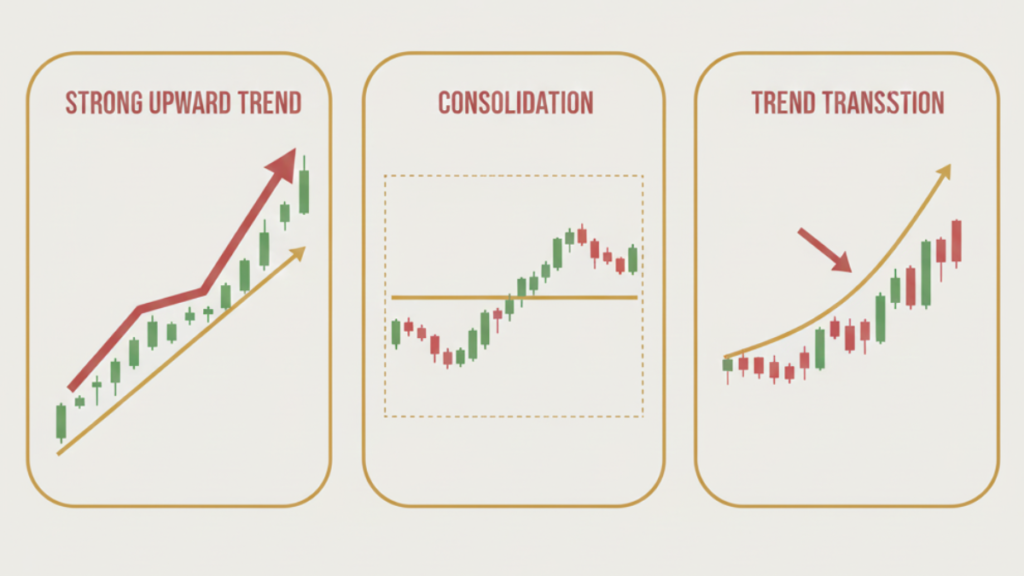
Moving average crossovers occur when a shorter-term average crosses above or below a longer-term average. While popular, crossovers are among the most misused signals.
Crossovers lag because they occur only after price has already moved significantly. Professionals therefore use crossovers as confirmation tools, not entry triggers. Crossovers are most effective when aligned with price structure, momentum indicators, and volume analysis.
Momentum Indicators and the Strength of Movement
Momentum indicators measure how fast price is changing, not the direction of movement. They help traders understand whether a move is accelerating, decelerating, or losing strength.
Relative Strength Index (RSI): Advanced Understanding
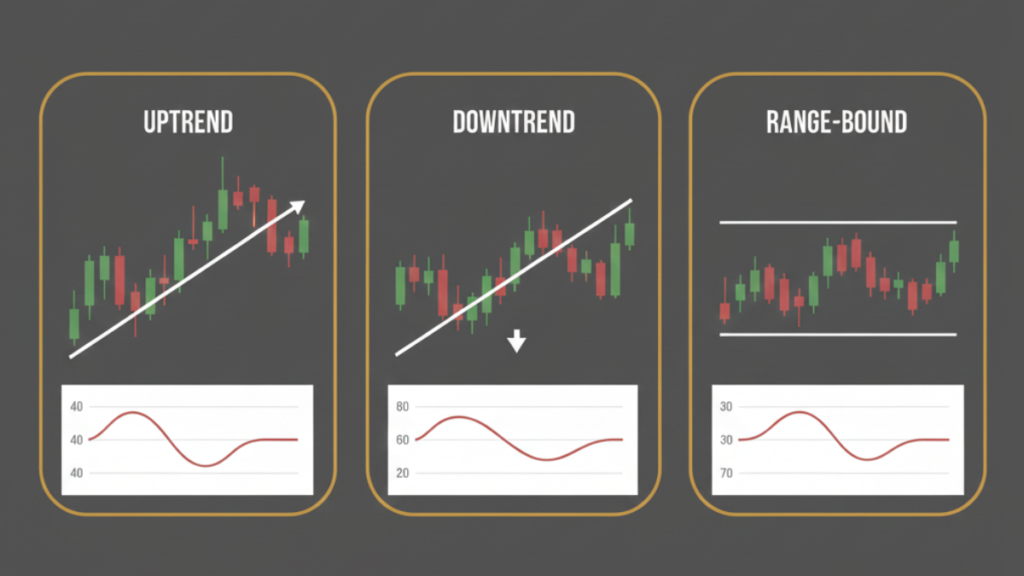
RSI compares average gains to average losses over a defined lookback period, typically 14 periods. It oscillates between 0 and 100, providing a standardized measure of momentum.
RSI measures internal strength of price movement, sustainability of trend momentum, and speed of participation. Contrary to popular belief, RSI is not primarily a reversal indicator.
In strong uptrends, RSI often remains between 40 and 80. In strong downtrends, RSI often remains between 20 and 60. This shift in behavior reflects changing market dynamics.
RSI Divergence as a Professional Tool
RSI divergence occurs when price makes higher highs while RSI makes lower highs, or when price makes lower lows while RSI makes higher lows. Divergence indicates momentum exhaustion, not immediate reversal.
Professionals treat divergence as a warning signal that must be confirmed by price structure and key levels. Used alone, divergence often leads to premature entries.
Stochastic Oscillator and Precision Timing
The stochastic oscillator measures where the closing price lies relative to its recent trading range. It is particularly effective in range-bound markets where price oscillates between support and resistance.
Stochastic identifies overextension within a range but performs poorly in strong trends, where price can remain overbought or oversold for extended periods. Professionals use stochastic selectively rather than universally.
Volatility Indicators and Market Expansion
Volatility indicators measure how much price is moving, not the direction of movement. Volatility is crucial for risk management, position sizing, and trade selection.
Bollinger Bands and Volatility Structure
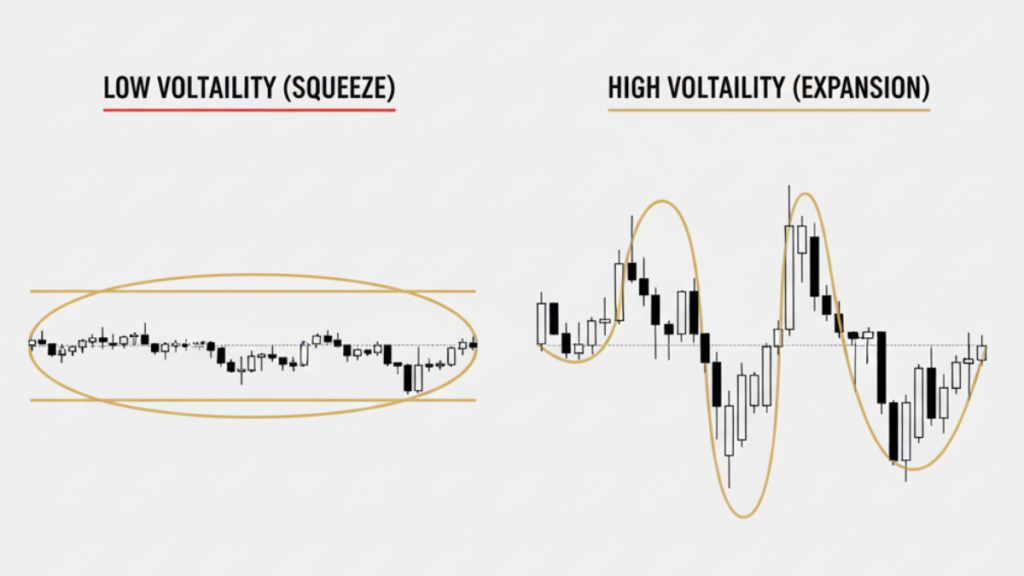
Bollinger Bands consist of a middle moving average and two outer bands based on standard deviation. When volatility is low, the bands contract. When volatility increases, the bands expand.
A Bollinger squeeze indicates compression and reduced participation. Compression often precedes expansion, but direction must be determined using price structure and volume.
Professionals do not trade volatility expansion blindly. They wait for confirmation.
Average True Range (ATR) as a Risk Tool
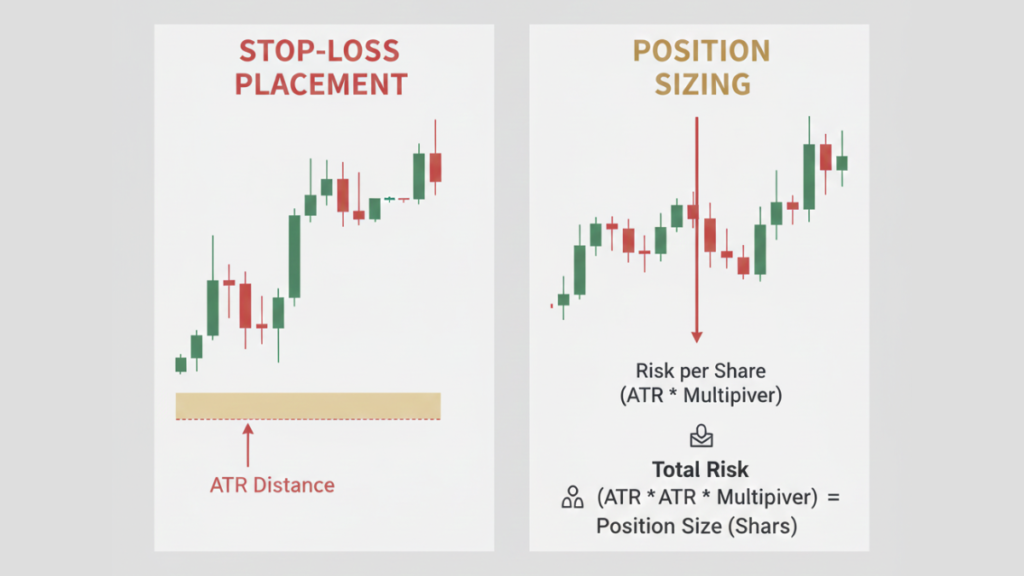
ATR measures average price movement over a specified period. It does not indicate direction and should not be used for entries.
Professionals use ATR to calculate stop-loss distance, adjust position sizing, and align risk with current market conditions. ATR-based risk management prevents stops that are too tight and exits driven by normal market noise.
Volume Indicators and Market Participation
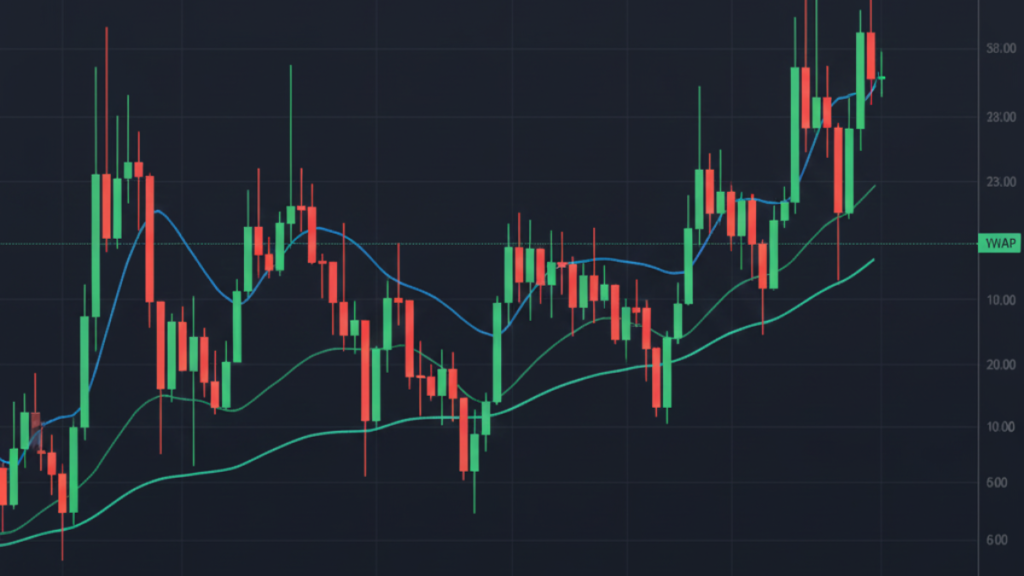
Volume reveals participation and conviction. Price movement without volume is often fragile and prone to failure.
Volume Analysis in Professional Trading
Healthy trends typically show increasing volume during impulsive moves and decreasing volume during pullbacks. This pattern suggests institutional accumulation or distribution rather than random trading.
Low-volume breakouts often fail because they lack broad participation.
VWAP as an Institutional Benchmark
VWAP represents the average price traded, weighted by volume. It is widely used by institutional traders to assess execution quality and cost efficiency.
Retail traders use VWAP to align with institutional bias, identify mean reversion opportunities, and avoid chasing extended price moves. VWAP is most effective in intraday contexts.
Trend Strength Indicators and Market Conditions
Trend strength indicators measure how strong a trend is, not its direction. This distinction is critical.
Average Directional Index (ADX)
ADX quantifies trend strength on a scale from 0 to 100. Values below 20 indicate weak or no trend, while values above 25 indicate strong trending conditions.
Professionals use ADX to select appropriate strategies. Trend-following systems perform poorly in low-ADX environments, while range-based strategies struggle in high-ADX markets.
Indicator Integration and the Professional Workflow
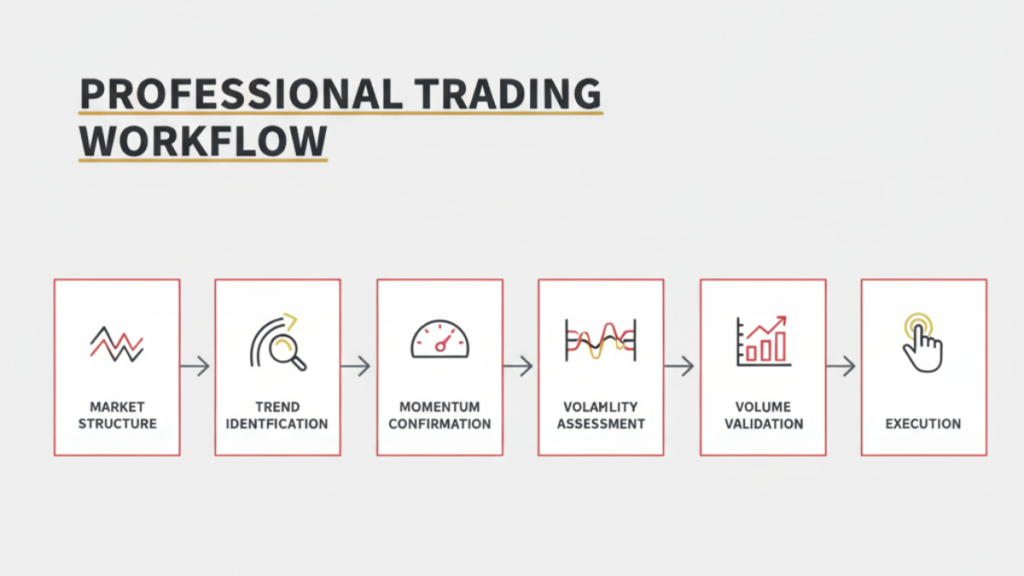
Professional traders do not rely on indicators in isolation. They follow a top-down process that begins with market structure and ends with execution.
This process typically involves identifying market structure, confirming trend direction, measuring momentum, assessing volatility, and validating participation. Indicators support decisions, but they never replace analysis.
Indicator Overload and Its Consequences
One of the most common mistakes traders make is using too many indicators. Excessive indicators create conflicting signals, increase hesitation, and destroy consistency.
Professional traders limit indicators and master interpretation rather than quantity. Simplicity improves execution.
Why Indicators Fail Without Proper Learning
Most indicator misuse comes from random internet learning, lack of market context, and absence of risk frameworks. Traders learn what indicators are, but not how to apply them consistently.
This is why many traders benefit from structured stock market education, such as stock market classes in Jaipur, where indicators are taught alongside price action, risk management, and real market exposure.
Final Conclusion
Technical indicators are analytical tools, not prediction machines. Used correctly, they improve clarity, reduce emotional errors, and support disciplined execution. Used incorrectly, they create dependency, increase losses, and damage confidence.
Mastery comes from understanding behavior, not memorizing settings. Traders who focus on structure, context, and risk management outperform those who chase signals.
Indicators support the process. Discipline sustains the trader. Join Vaishvik Traders, the best stock market institute in Jaipur to learn all the fundamentals about the stock market with live practical classes.
Trading is often portrayed as a game of predictions — finding the next big move, catching the perfect breakout, or timing the exact reversal. In reality, professional trading is not about prediction at all. It is about risk management.
Markets are uncertain by nature. Even the best strategy fails sometimes. What separates consistent traders from struggling ones is not how often they are right, but how well they control losses when they are wrong.
This article breaks down risk management from a technical, professional perspective. Whether you trade stocks, options, forex, or indices, mastering these principles is non-negotiable if you want to survive long term.
Understanding Risk in Trading (Beyond the Basics)
Risk in trading is not just about losing money. It is about exposure.
Every trade exposes your capital to:
- Market volatility
- Execution risk
- Emotional decision-making
- Structural market uncertainty
Professional traders define risk before they place a trade, not after price moves against them.
Risk is quantifiable. Hope is not.
Why Most Traders Fail Without Realizing It
Retail traders often believe they fail because:
- Their strategy is weak
- Indicators don’t work
- The market is manipulated
In reality, most failures come from:
- Oversized positions
- No predefined stop loss
- Emotional averaging
- Inconsistent execution
A trader with an average strategy and strong risk management will outperform a trader with a great strategy and poor risk control.
Position Sizing: The Foundation of Risk Management
Position sizing answers one question:
How much should I trade on this setup?
Most beginners decide position size based on:
- Available margin
- Confidence level
- Recent wins or losses
Professionals decide position size based on:
- Account size
- Risk per trade
- Stop-loss distance
The Fixed Percentage Risk Model
A widely used professional approach is risking a fixed percentage of capital per trade.
Example:
- Trading capital: ₹5,00,000
- Risk per trade: 1%
- Maximum loss allowed: ₹5,000
If your stop loss is hit, your loss is predefined and controlled.
This approach ensures:
- No single trade can damage your account
- Emotional pressure stays low
- Longevity in the market
Stop Loss: The Line Between Trading and Gambling
A stop loss is not a failure point.
It is an invalidation point.
Professionals place stop losses based on market structure, not emotions.
Technically Sound Stop Loss Placement
Stop losses are usually placed:
- Beyond demand or supply zones
- Below/above recent swing highs or lows
- Beyond key liquidity levels
A stop loss should answer:
At what price is my trade idea proven wrong?
If you cannot answer that, you are guessing — not trading.
Risk–Reward Ratio: Why Accuracy Alone Doesn’t Matter
Many traders obsess over win rate. Professionals focus on risk–reward asymmetry.
A trader can be profitable with:
- 40% win rate
- 1:3 risk–reward
That means:
- Losing trades are small
- Winning trades are meaningful
Example:
- Risk per trade: ₹2,000
- Target: ₹6,000
You can be wrong more often than right and still grow your account.
This is why professional trading systems prioritize:
- Asymmetric payoffs
- Selective entries
- Patience
Drawdown Management: The Silent Account Killer
Drawdown is the percentage decline from your account’s peak.
Most traders ignore drawdown until it becomes dangerous.
Why Drawdowns Matter Technically
A 10% drawdown requires an 11% recovery
A 30% drawdown requires a 43% recovery
A 50% drawdown requires a 100% recovery
The deeper the drawdown, the harder the recovery.
Professionals cap drawdowns by:
- Reducing position size during losing streaks
- Taking breaks after consecutive losses
- Avoiding emotional revenge trading
Emotional Risk vs Market Risk
Not all risk comes from price movement.
Emotional risk includes:
- Fear of missing out
- Overconfidence after wins
- Revenge trading after losses
- Breaking rules under pressure
This is why professional traders use:
- Written trading plans
- Predefined rules
- Journals to track behavior
Systems reduce emotional interference. Discipline preserves capital.
Risk Management in Different Market Segments
Equity Trading
- Lower leverage
- Slower moves
- Risk comes from gaps and news
Intraday Trading
- Faster execution
- Tight stop losses
- Higher emotional pressure
Options Trading
- Hidden risk through volatility
- Time decay (Theta)
- Complex risk profiles
Forex Trading
- High leverage
- News-driven volatility
- Overnight exposure
Each market requires adjusted risk rules, but the principles remain the same.
The Role of Journaling in Risk Control
Professional traders track:
- Entry reason
- Stop loss logic
- Position size
- Emotional state
- Outcome
Journaling reveals:
- Repeated mistakes
- Overtrading patterns
- Risk violations
Without data, improvement is impossible.
Why Structured Training Accelerates Risk Mastery
Risk management is not intuitive.
It must be trained and practiced under guidance.
This is why traders who learn through:
- Random videos
- Telegram tips
- Trial-and-error
Take much longer to develop consistency.
Learning risk management through a structured environment, such as a professional stock market institute in Jaipur, helps traders:
- Understand real market behavior
- Apply risk rules in live markets
- Develop discipline early
Risk Management Is a Skill, Not a Rulebook
Many traders know risk rules intellectually but fail to apply them emotionally.
Professional trading education focuses on:
- Behavior under pressure
- Rule-following consistency
- Long-term capital protection
Risk management is not about avoiding losses. It is about controlling them.
Final Thoughts: Survival Before Profits
The market rewards longevity.
If you protect your capital:
- You stay in the game
- You gain experience
- You compound skill over time
If you ignore risk:
- One emotional decision can erase months of progress
Professional traders think in terms of process, not outcomes.
Master risk first. Profits follow as a byproduct.
Most people enter the stock market with excitement. Charts look interesting, profits seem possible, and online success stories fuel confidence. Yet, if you observe closely, you’ll notice one uncomfortable truth: most beginners quit within the first year.
It’s not because they lack intelligence. It’s not because the market is unfair. And it’s rarely because they picked the “wrong strategy.”
The difference between traders who survive and those who disappear is subtle – but powerful. Successful traders learn certain lessons early, while beginners often learn them too late, after costly mistakes.
Success in Trading Is Quiet, Not Flashy
Beginners often believe good trading looks dramatic – big candles, fast moves, quick profits. Successful traders know the opposite is true.
Real trading success is quiet. It involves waiting, observing, and doing nothing most of the time. It involves following rules consistently, even when emotions tempt you otherwise.
Experienced traders don’t chase excitement. They chase clarity.
This mindset shift alone separates long-term traders from impulsive beginners.
Lesson #1: Discipline Matters More Than Strategy
Most beginners spend months hopping from one strategy to another. One week it’s indicators. Next week it’s price action. Then it’s something new they saw online.
Successful traders learn early that discipline beats complexity.
They pick one method and stick with it long enough to understand:
- How it fails
- When it works best
- How emotions interfere with execution
Strategy hopping feels productive, but it often hides impatience and lack of confidence.
Lesson #2: Losses Are Part of the Job
Beginners take losses personally. Every losing trade feels like a failure, which leads to frustration, overtrading, or revenge decisions.
Experienced traders learn something different early on:
Losses are not mistakes. They are operating costs.
Just like a business has expenses, trading has losses. Successful traders focus on:
- Controlling the size of losses
- Protecting capital
- Maintaining emotional stability
They don’t try to avoid losses, they learn to manage them.
Lesson #3: Emotional Control Is a Skill, Not a Trait
Many beginners believe emotional control is something you either have or don’t have. This belief causes frustration.
Successful traders understand early that emotional control is learned through exposure, not motivation.
You cannot “think” your way into emotional discipline. It develops when you:
- Observe live markets daily
- Experience profits and losses
- Learn how emotions show up during decisions
This is why traders who gain real market exposure early tend to improve faster and make fewer repeated mistakes.
Lesson #4: Knowing When Not to Trade Is a Superpower
Beginners want to trade every day. They believe activity equals progress.
Experienced traders learn early that selectivity is more powerful than activity.
They understand that:
- Not every day offers opportunity
- Forcing trades increases risk
- Waiting protects both capital and mindset
The ability to stay out of the market is often what keeps traders in the game long enough to succeed.
Lesson #5: Confidence Comes From Experience, Not Information
Many beginners consume endless content such as videos, articles, charts, yet still hesitate when it’s time to trade.
Successful traders learn early that:
- Confidence doesn’t come from more information
- Confidence comes from repeated market exposure
By watching live charts, observing market behavior, and tracking their decisions, they build confidence rooted in experience – not excuses.
This is also why traders who combine learning with structured exposure often develop faster than those who learn in isolation.
Lesson #6: Risk Management Is Non-Negotiable
Beginners talk about profits. Successful traders talk about risk.
Early in their journey, consistent traders accept a simple truth:
One bad decision should never end your trading journey.
They focus on:
- Position sizing
- Predefined risk
- Capital preservation
Understanding risk early prevents emotional decision-making later.
Lesson #7: Markets Don’t Reward Intelligence – They Reward Consistency
Many highly intelligent people struggle in trading. Meanwhile, calm, patient traders with average technical knowledge thrive.
Why?
Because markets reward:
- Consistency over brilliance
- Process over prediction
- Discipline over confidence
Successful traders learn early that trading is less about being right and more about being consistent.
Why Most Beginners Learn These Lessons Too Late
The hardest part about trading is that lessons don’t come with warnings. The market teaches through consequences.
Beginners often learn:
- Emotional control after a big loss
- Risk management after capital damage
- Discipline after burnout
Those who learn these lessons earlier through observation, guidance, and real exposure, avoid repeating the same painful cycles.
This is why many learners eventually turn toward structured stock market classes that emphasize live market understanding, discipline, and decision-making – not just theory.
The Difference Between Learning Trading and Doing Trading
Learning trading is comfortable. Doing trading is uncomfortable.
Successful traders accept discomfort as part of growth. They don’t avoid it – they work through it.
They understand that:
- Confusion fades with exposure
- Fear reduces with repetition
- Discipline grows with structure
This is the stage where real learning begins.
Final Thoughts
Most beginners fail not because they lack potential, but because they learn the wrong lessons – or learn the right ones too late.
Successful traders don’t rely on secrets or shortcuts. They build:
- Emotional awareness
- Risk discipline
- Patience
- Consistency
They learn early that markets reward behavior, not hope.
For anyone starting their journey, the goal isn’t fast profits – it’s understanding the process. Those who focus on learning correctly early on give themselves a real chance to grow, survive, and eventually trade with confidence.
Join Vaishvik Traders, the No. 1 Stock market institute in Jaipur and learn through live practical classes from the best mentors.